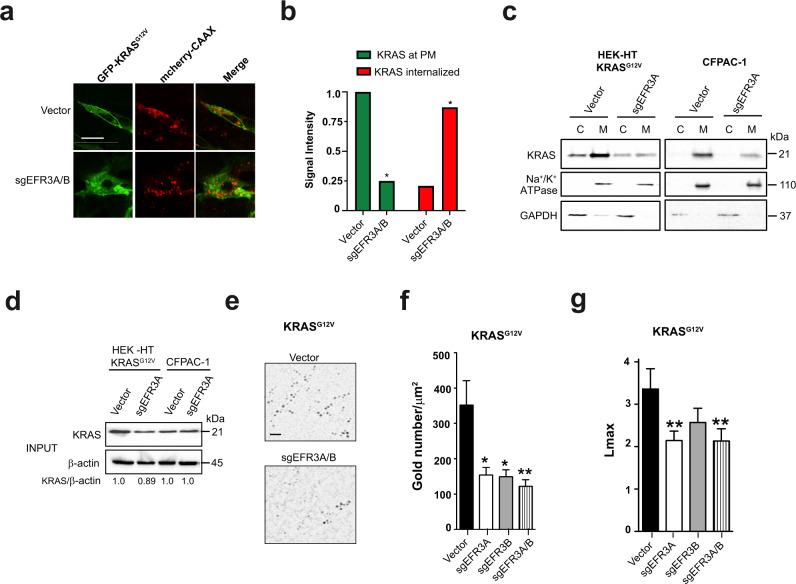
Fig. 6. EFR3A promotes the localization and nanoclustering of KRAS at the plasma membrane.
a Representative confocal images showing the distribution of ectopically expressed GFP-KRASG12V, mCherry-CAAX, or both protein (merge) in HEK-HT cells stably infected with a lentiviral vector encoding Cas9 and no sgRNA (vector) or sgEFR3A/B. Scale bar: 20 μm. b Mean ± SD signal intensity of GFP-KRASG12V at the plasma membrane (KRAS at PM) versus internalized (KRAS internalized) in the same two cell lines. c Levels of KRAS and Na+/K + ATPase (PM marker), and GAPDH (cytosolic marker), as assessed by immunoblot analysis, in the cytosolic (C) versus membrane (M) fraction of KRASG12V-transformed human HEK-HT cells or the human pancreatic adenocarcinoma cell line CFPAC-1 stably infected with a lentivirus encoding Cas9 and no sgRNA (vector) or sgEFR3A. d Levels of KRAS versus actin as a loading control in the same cells from the endomembrane fraction. e–g A (e) representative EM micrograph showing gold conjugated, GFP-specific antibody (black dots) bound to GFP-KRASG12V, (f) mean ± SEM of gold particles per 1 μm2 of plasma membrane sheets representative of the amount of KRAS on the plasma membrane, and (g) the extent of nanoclustering of KRAS on the plasma membrane as measured by Lmax from human HEK-HT cells transiently expressing GFP-KRASG12V and stably infected with a lentivirus(es) encoding Cas9 with no sgRNA (vector) or the indicated sgRNAs. Scale bar: 100 nm. a–d Representative of 3 biological replicates. e, f EM analysis is based on 30 images. Replicate experiments and full-length gels are provided in Supplementary Fig. 13. Significance values were calculated by one-sided student’s t test for (b) and two-sided bootstrap test for (f, g): *p < 0.05 and **p < 0.01. Specific p values for (b) are 0.011 (sgEFR3A/B KRAS at PM) and 0.024 (sgEFR3A/B KRAS internalized), f are 0.0138698 (sgEFR3A), 0.0117821 (sgEFR3B), and 0.005275 (sgEFR3A/B), g are 0.001 (sgEFR3A), 0.424 (sgEFR3B), and 0.001 (sgEFR3A/B).

