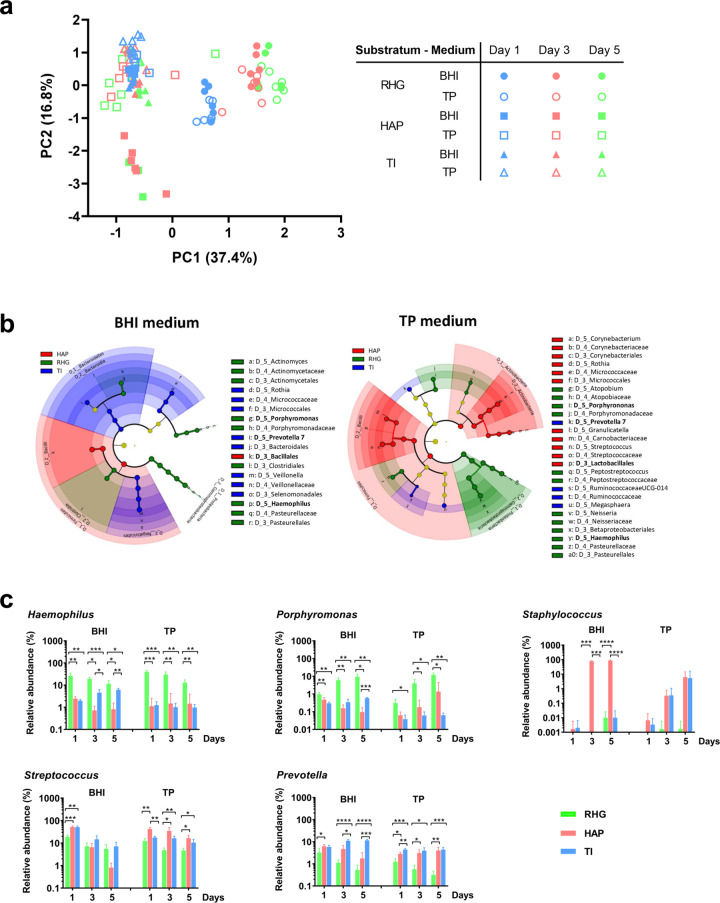
Fig. 3. Ordination of microcosm biofilms grown under different conditions.
a Principal component analysis (PCA) plot of microcosm biofilms grown in BHI or TP and on different substratum (RHG, HAP or TI) over time (day 1, 3 or 5). b Cladogram represents the differentially abundant orders, families and genera in the biofilms grown on the surfaces of RHG, HAP and TI when the growth medium was BHI or TP. The root denotes the domain bacteria. The taxonomic level of class is labeled, while order, family and genus are abbreviated. The color shade indicates the abundance of substratum-specific taxa. The size of each node represents their relative abundance. The cladogram was plotted based on the logarithmic LDA score calculated in LEfSe with an effect size cutoff of 4.0. The bacterial genera or higher level appeared in both BHI and TP medium on the same substratum are in bold. c The relative abundance (%) of individual bacterial genera in microcosm biofilms grown on the surfaces of RHG, HAP and TI. The substratum-specific individual bacterial genera (or higher level) were selected based on the results shown in the cladogram: Haemophilus and Porphyromonas for RHG-biofilms; the class Bacilli for HAP-biofilm and Prevotella for TI-biofilms. The relative abundances of Staphylococcus and Streptococcus, representatives of Bacillales and Lactobacillales, are shown. Data are shown as mean ± standard deviation. The * represents statistically significant difference (p < 0.05) compared using two-way ANOVA with Bonferroni’s multiple comparisons test in Prism 8 version 8.2.1. RHG: Reconstructed Human Gingiva; HAP: hydroxyapatite discs; TI: titanium discs. TP: Thompson medium. Data represent the average of 3 independent experiments, each performed in replicates.

