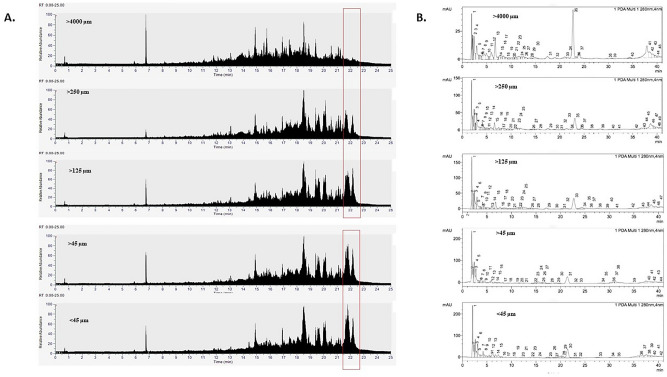
Figure 3.
Mass Spectrometry analysis of S. cristaefolium extracts with varying particle sizes. (A) Comparative HR-ESI–MS analysis showing different metabolite compositions. The red box indicates changes in phytochemical composition. (B) HPLC analysis of phenolic compounds showing increased concentration in samples with smaller particles. Known standards are listed as follows, 1. EGC-Epigallocatechin; 2. PCA-Protocatechuic Acid; 3. C-Catechin hydrate; 4. ECG-Epicatechin gallate; 5. EGCG-Epigallocatechin gallate; 6. QUE-Quercetin.

