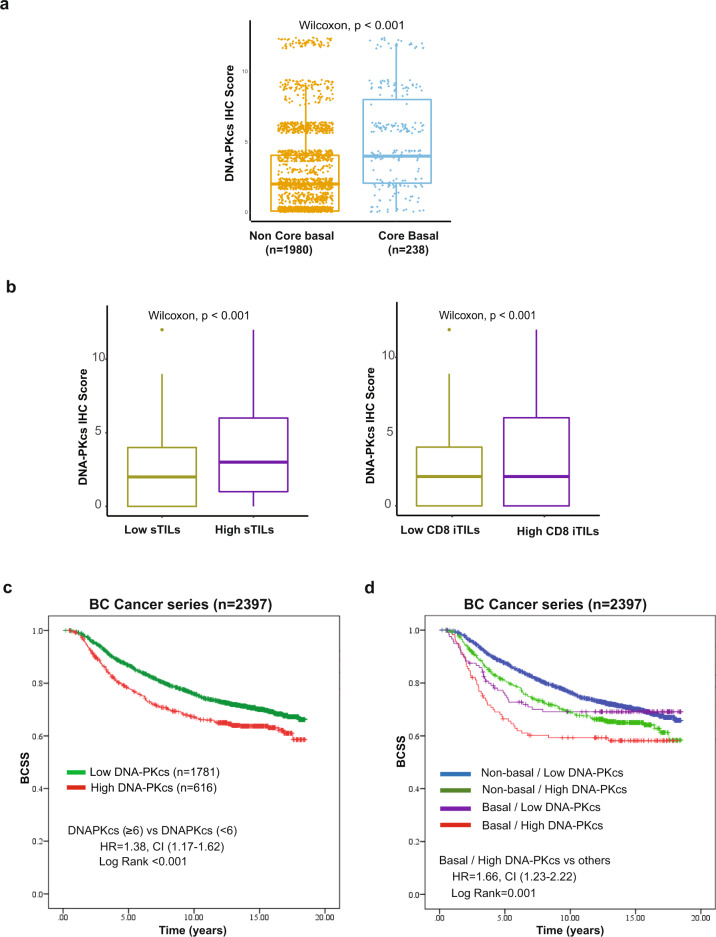
Fig. 3. Analysis of DNA-PKcs expression in the BC Cancer series (n = 2401).
a Boxplots showing the expression levels of DNA-PKcs by IHC according to “core basal status”. High expression of DNA-PKcs is associated with the core basal IHC phenotype (p-value < 0.001). Core basal is defined as ER-, PR-, Her2- and [EGFR + or CK5 + ]. The median (center bar), and the third and first quartiles (upper and lower edges, respectively) are shown. b Boxplots showing the expression levels of DNA-PKcs by IHC according to “sTILs” and “CD8 + iTILs” categories. High expression of DNA-PKcs is associated with high expression of sTILs and high expression of CD8 + iTILs. The median (center bar), and the third and first quartiles (upper and lower edges, respectively) are shown. c Kaplan–Meier curves for BCSS in the BC Cancer series according to DNA-PKcs IHC expression status. d Kaplan–Meier curves for BCSS stratified according to core basal status and DNA-PKcs IHC expression. Core basal tumors with high DNA-PKcs expression are associated with the worst BCSS. Abbreviations: IHC immunohistochemistry, sTILs stromal tumor-infiltrating lymphocytes, iTILs intraepithelial tumor-infiltrating lymphocytes, BCSS breast cancer-specific survival.

