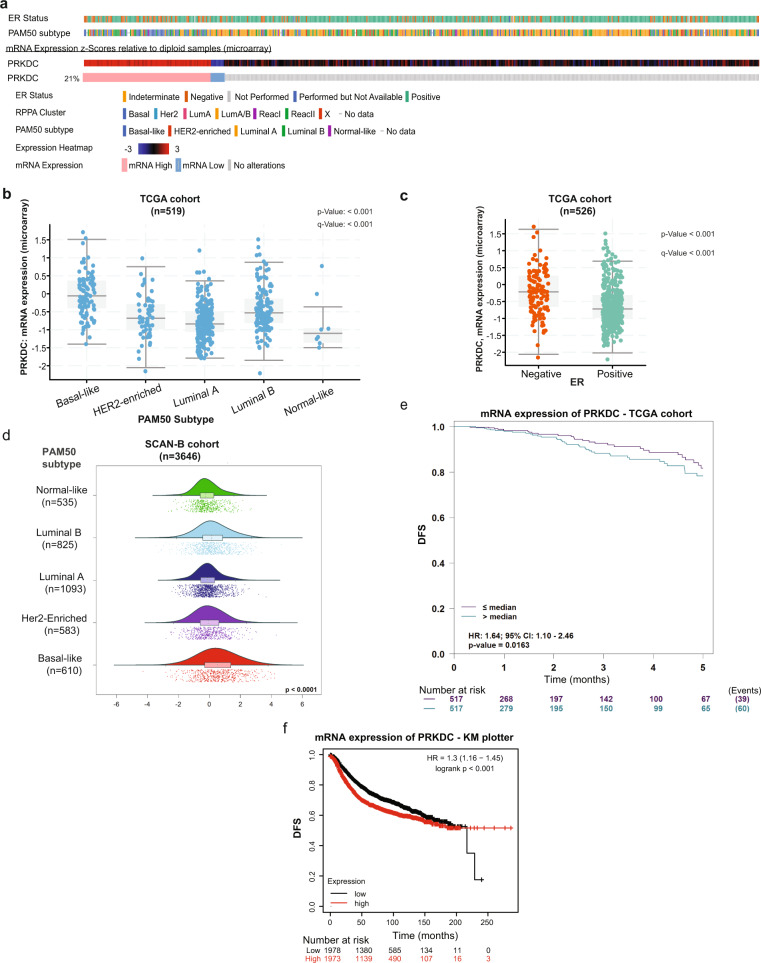
Fig. 6. Analysis of PRKDC expression using publicly-available breast cancer datasets.
a Oncoprint outlining the biological classifications of 825 cases included in the TCGA invasive breast cancer cohort according to ER status, PAM50 subtype, RPPA cluster, and PRKDC mRNA expression as determined by microarray. b–c Boxplots showing the expression levels of PRKDC, as derived from microarray in the TCGA invasive breast cancer cohort, is significantly associated with basal-like PAM50 intrinsic subtype. The median (center bar), and the third and first quartiles (upper and lower edges, respectively) are shown. c Data were obtained through the cBioPortal for Cancer Genomics database74. d Raincloud plots showing the expression level of PRKDC, as derived from RNA-seq on the SCAN-B breast cancer cohort, is significantly associated with basal-like PAM50 intrinsic subtype. e–f Kaplan–Meier survival curves showing the association between PRKDC expression and DFS on cases from the TCGA invasive breast cancer cohort (e) and 35 Gene Expression Omnibus breast cancer datasets (f). Plots were generated using the bc-GenExMiner v4.575 and the KMplotter analysis platform curated from 35 Gene Expression Omnibus breast cancer datasets41. Abbreviations: ER estrogen receptor, IHC immunohistochemistry, DFS disease-free survival.

