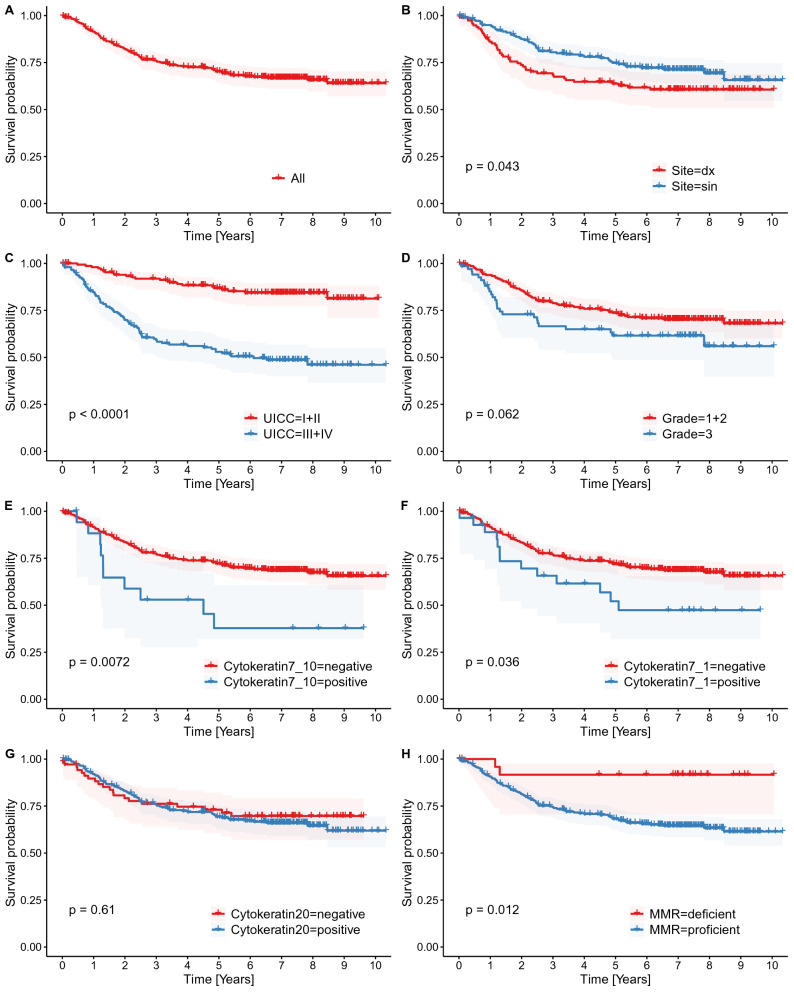
Figure 4.
Kaplan Meier curves documenting CSS analysis concerning several selected variables. All death are showed in (A). There is a significantly worse survival in proximally situated tumors (B), advanced stage tumors (C), MMR-proficient tumors (H), CK7 + tumors using positivity cut-off on 10% (E) as well as on 1% (F). Using higher cut-off, the P-value is lower despite lower number of CK7 + cases (see discussion). Histopathological grade (D) is borderline insignificant despite visible trend in the curves. CK20 status (G) has no influence on survival.

