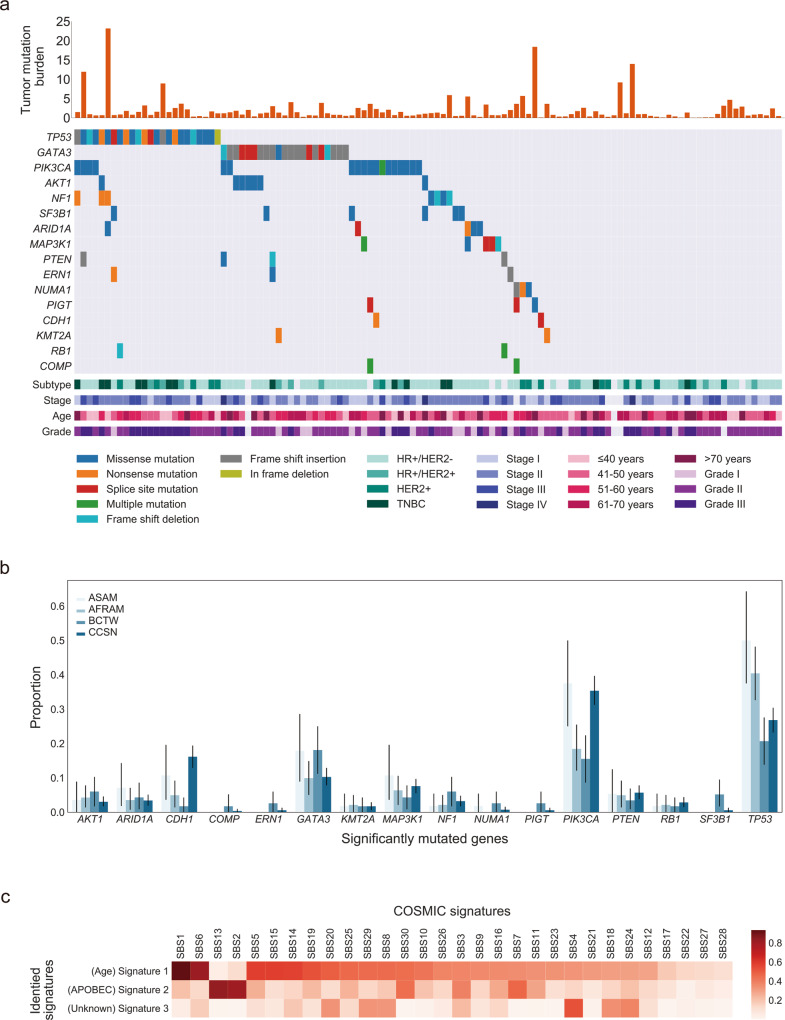
Fig. 1. Mutational landscape of somatic alteration and single base substitution mutational signatures (SBSs) in 116 breast cancer samples.
a Rows represent significantly mutated genes (SMGs), and columns represent individual tumors. Samples are arranged to emphasize mutual exclusivity among alterations. SMGs are ordered according to the frequency of nonsynonymous single-nucleotide variations/indels. The stacked bar plot depicts the tumor mutation burden (TMB; mutations/covered bases; y-axis) for individual tumors (x-axis). Key clinical features are annotated for each tumor. Clinical characteristics and mutation types are indicated with color. b The bar plot with the 95% confidence interval indicates mutational frequencies of BCTWs, compared with those from The Cancer Genome Atlas benchmark cohorts (right; BCTW, Taiwanese; CCSN, Caucasian; AFRAM, African American; ASAM, Asian American). c Heatmap of the cosine similarity results for the three de novo SBSs of the Taiwanese population (y-axis), coded by color. In the scale bar, the cosine similarity (range 0–1) represents the extent of similarity to a particular signature of COSMIC (x-axis). Among the 30 COSMIC SBSs, the APOBEC- and age-related signatures were the most similar mutational signatures detected in the Taiwanese population (dark red), while one signature was dissimilar to any COSMIC mutational signatures and thus is considered unknown.

