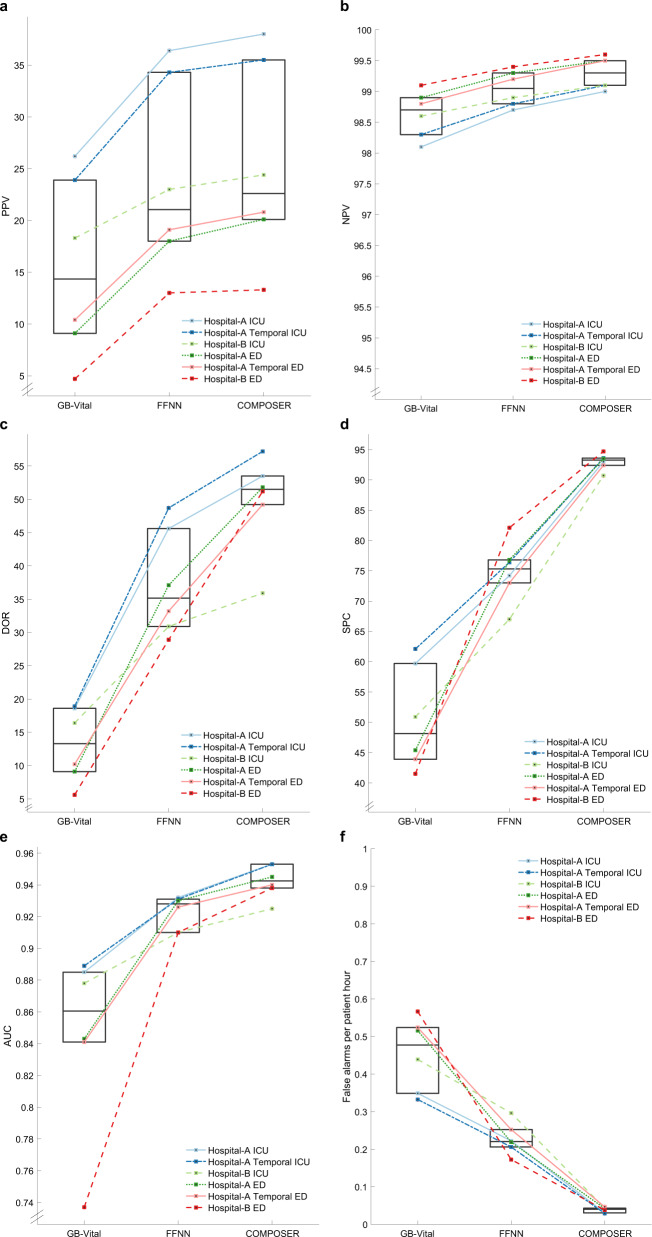
Fig. 2. Summary of COMPOSER performance.
Comparison of COMPOSER model against GB-Vitala and a feedforward neural network (FFNNb). The line plots in a–f shows the relative improvement in positive predictive value (PPV), negative predictive value (NPV), diagnostic odds ratio (DOR), specificity (SPC), Area Under the Curve (AUC) and number of false alarms per patient hour (FAPH)+, respectively. The median and interquartiles for all six cohorts (three ICUs and three EDs) are summarized via superimposed box plots. In comparison, ESPMc (not shown here) achieved an AUC of 0.889 (PPV = 31.2%, NPV = 97.8%, DOR = 23.2, SPC = 84.3, FAPH = 0.132) and 0.876 (PPV = 35.9%, NPV = 96.8%, DOR = 17.4, SPC = 94.2%, FAPH = 0.05) across Hospital-A temporal ICU and ED. aGB-Vital corresponds to a Gradient Boosted Tree (XGBoost)6,15 built using six vital signs measurements: systolic blood pressure, diastolic blood pressure, heart rate, respiratory rate, oxygen saturation and temperature. bFFNN corresponds to a 2 layer feedforward neural network that uses the same number of input features as that of COMPOSER. The starting point of y-axis for a and b were determined by the chance level of a classifier at the lowest prevalence rate. cESPM corresponds to the Epic’s commercially available Best Practice Advisory (BPA) alert. We only had access to the risk scores produced by this system at Hospital-A during the temporal validation time-frame. + False alarms per patient hour (FAPH) can be used to calculate the expected number of false alarms per unit of time in a typical care unit (e.g., a FAPH of 0.025 translates to roughly 1 alarm every 2 h in a 20-bed care unit).

