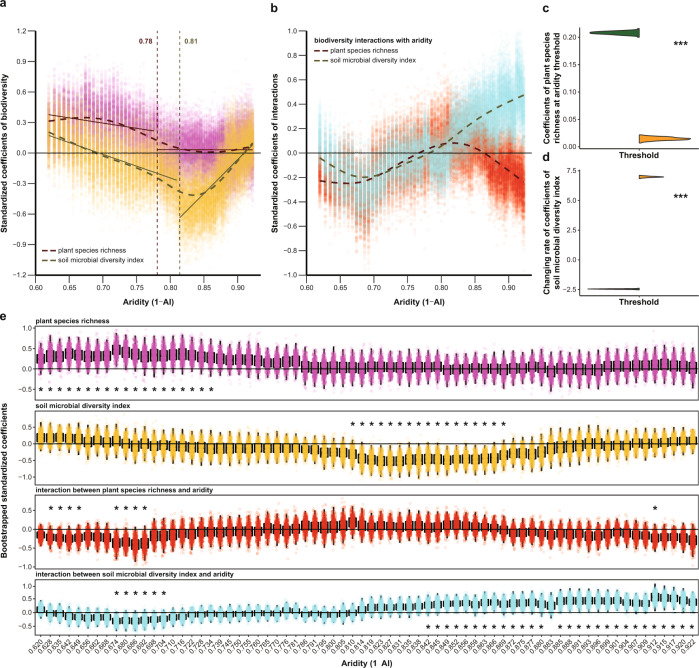
Fig. 3. Nonlinear changes of relationships between biodiversity and its interactions with aridity and soil multifunctionality along aridity gradients.
a, b Nonlinear changes of standardized coefficients of biodiversity (a) and the interactions between biodiversity and aridity (b) obtained from a linear mixed-effects model (Eq. 3) throughout a moving subset window of the field sites surveyed along aridity gradients. The dots indicate the bootstrapped coefficients of the fixed terms shown for each subset window. The dashed lines denote the nonlinear trend fitted by GAMs. In (a), the vertical dashed lines and inset numbers represent the aridity thresholds identified, and the solid lines represent the linear fits at both sides of each aridity threshold. c, d Violin diagrams show bootstrapped predicted values at the threshold (c) and bootstrapped slopes (d) of the two regressions existing at each side of the aridity threshold found for plant species richness and the soil microbial diversity index in (a), respectively (dark green for the regression before the threshold and orange for the regression after the threshold). Significant differences between before and after the threshold are determined using an unpaired two-sided Mann–Whitney U-test. Significance level is: ***P < 0.001. e Boxplots demonstrate the distribution of bootstrapped standardized coefficients corresponding to those in (a, b) for each subset window (N = 500 independent simulations). Boxplots show the median (center line), 25th and 75th percentiles of each distribution. Whiskers represent the minimum and maximum values that remain inferior 1.5 times the interquartile range below or above the distribution median. Asterisks indicate significant values of coefficients at 95% confidence intervals (one-sided P ≤ 0.05).

