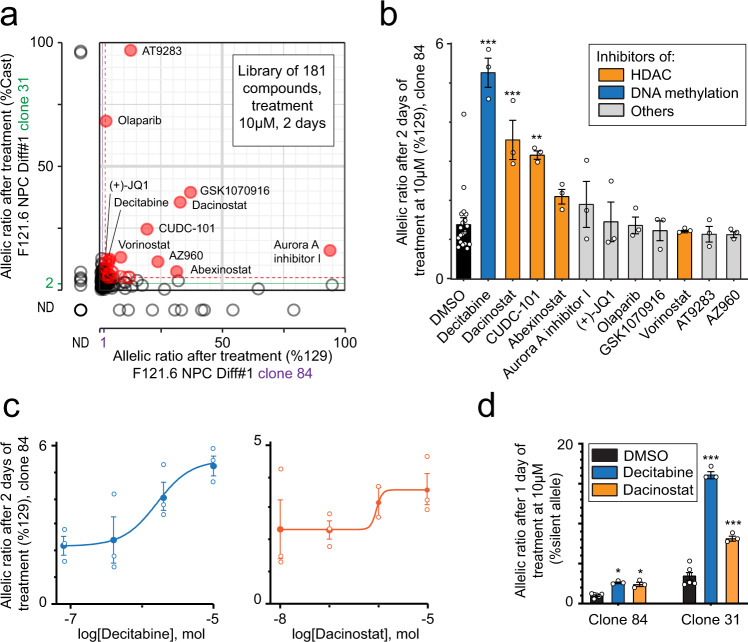
Fig. 8. Epigenetic maintenance of the monoallelic expression of Bag3.
a Effect of treatment with an epidrug library (2 days at 10 µM) on the allelic expression ratio of two NPC clones (#31 and #84), measured by pyrosequencing following RT-PCR. Purple and green lines represent the mean of the 11 controls, dashed red lines are mean + 3 x Stdev, red circles are compounds with an effect > mean + 3 x StDev for both clones. ND no data b Validation of three compounds among the 11 best hits from (a) on NPC clone #84 (2 days of treatment at 10 µM). DMSO is used as the vehicle. Data were means ± SEM (n = 3 replicates per condition). One‐way ANOVA: treatment effect, F(11,40) = 12, p < 10−4. Dunnett’s post hoc test: *p < 0.05, ***p < 10−4 (DMSO versus treatment). c Dose-response curve for Decitabine and Dacinostat for NPC clone #84, after 2 days of treatment. Data were means ± SEM (n = 3 replicates per condition). d Confirmation of the effect of Decitabine and Dacinostat on NPC clones #31 and #84, after 1 day of treatment at 10 µM. DMSO is used as the vehicle. Data were means ± SEM (n = 3 replicates per condition). Two‐way ANOVA: treatment effect, F(2, 18) = 200, p < 10−4; clone effect F(1,18) = 548, p < 10−4; interaction, F(2,18) = 120, p < 10−4. Bonferroni post hoc test: *p < 0.05, ***p < 10−4 (DMSO versus treatment).

