
Figure 2.
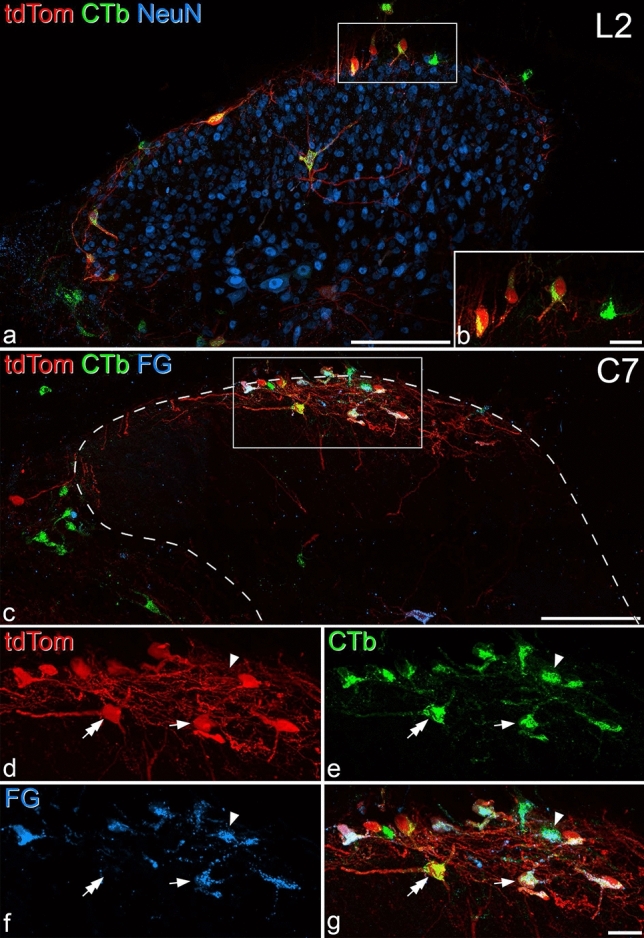
The relationship between retrograde labelled and Phox2a-positive cells. (a) Transverse section through the L2 segment of experiment #4, showing the side contralateral to the cholera toxin B subunit (CTb) injection into the lateral parabrachial area. The section has been immunostained to reveal tdTomato (tdTom, red), CTb (green) and NeuN (blue). Several retrogradely labelled neurons are visible, and most of these are in lamina I. Several of these are also tdTom-positive, and therefore appear yellow. The box shows the region corresponding to (b). (b) Part of lamina I from the same section showing 4 retrogradely-labelled lamina I cells, which contain CTb in the cytoplasm. The one on the right side is negative for tdTom, while the other three are tdTom-positive. (c) Transverse section through the C7 segment of experiment #6, showing the side contralateral to the CTb and Fluorogold (FG) injections. The section has been stained to reveal tdTom (red), CTb (green) and FG (blue). There is a cluster of retrogradely labelled cells, many of which are tdTom-positive in the central part of lamina I. The dashed line shows the outline of the grey matter, and the box indicates the region shown at higher magnification in (d–g). (d–g) Separating the individual colours reveals several patterns of co-localisation, including CTb-positive cells that also contain FG and tdTom (example shown with arrow). There are also tdTom-negative cells that are labelled with both CTb and FG (example shown with arrowhead) and CTb-labelled tdTom-positive cells that lack FG (example shown with double arrow). All images are from maximum intensity projections of confocal image scans (1 μm z-separation) through the full thickness of the 60 μm sections. In both (a,c), medial is to the right. Scale bars: (a,c) = 100 μm; (b,d–f) = 20 μm.