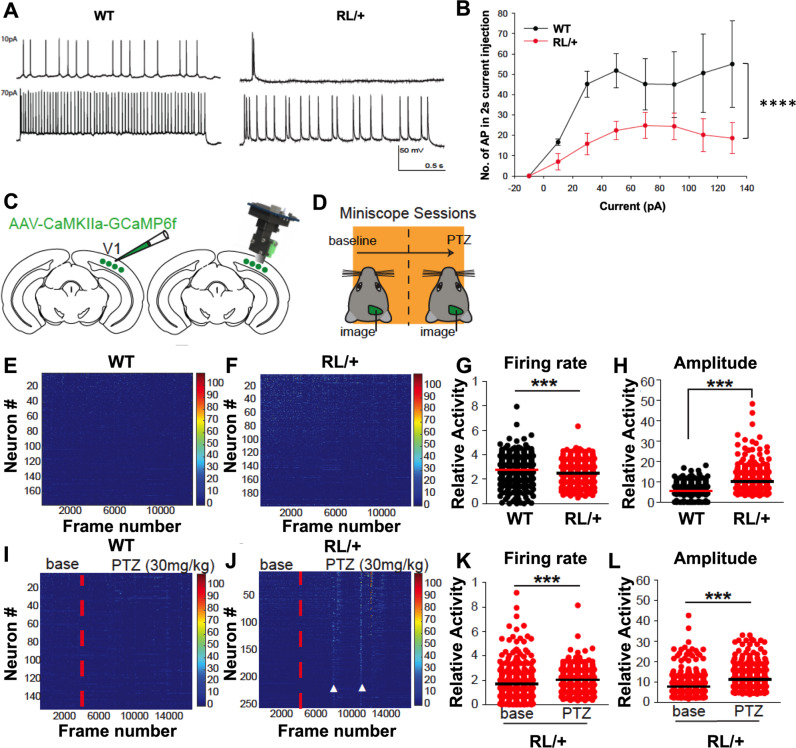
Fig. 4. RL/+ mutants exhibit significantly increased neural excitability and seizure susceptibility.
A Representative action potential firing pattern in WT (left) and RL/+ (right) neurons observed during injection of 10 and 70 pA. B The number of action potentials fired during a 2-s current injection is plotted against the corresponding level of current. RL/+ mutants had significantly less firing compared to WT; Friedman’s test. C Cartoon depicting viral injection (AAV-CAMK2a-GCaMP6f) into visual cortex and placement of GRIN lens at the injection site to allow for miniscope recordings. D Experimental timeline. Recordings were first conducted at baseline (data shown in E–H). One week later, mice were subjected to 5 min of baseline recordings followed by PTZ administration. Recordings continued for 15 min after PTZ (data shown in I–L). E Representative raster plot of neural calcium response of three WT littermates (432 total number of neurons), and F 3 RL/+ mutants (420 total number of neurons). G Distribution of single cell firing rates (WT: mean ± SD = 0.28 ± 0.11 Hz, RL/+ : mean ± SD = 0.25 ± 0.08 Hz). Firing rate is calculated by (total number of calcium peaks)/(total time); Mann–Whitney test. H Distribution of single cell sum peak amplitudes (WT: mean ± SD = 6.02 ± 3.26 dF/F, RL/+ : mean ± SD = 11.82 ± 5.35 dF/F); Mann–Whitney test. I, J Raster plots of neural calcium response from two WT (289 total number of neurons) and two RL/+ mice (289 total number of neurons) before and after PTZ administration (vertical red dotted line). J RL/+ mutants exhibited large synchronous neural responses during seizures (white arrow heads). K Distribution of single cell firing rates during baseline or PTZ sessions for RL/+ mutants. RL/+ baseline: mean ± SD = 0.16 ± 0.12 Hz, RL/+ PTZ: mean ± SD = 0.21 ± 0.0811 Hz. WT littermates did not show significantly increased firing rates after PTZ treatment; Mann-Whitney test. L Distribution of single cell sum peak amplitudes in baseline or PTZ sessions for RL/+ mice; RL/+ baseline: mean ± SD = 7.89 ± 5.10 Hz, RL/+ PTZ: mean ± SD = 11.15 ± 5.98 Hz. WT littermates did not exhibit significantly increased amplitudes after PTZ administration; Mann–Whitney test. ***P ≤ 0.001, ****P ≤ 0.0001. Data are presented as mean ± SD.

