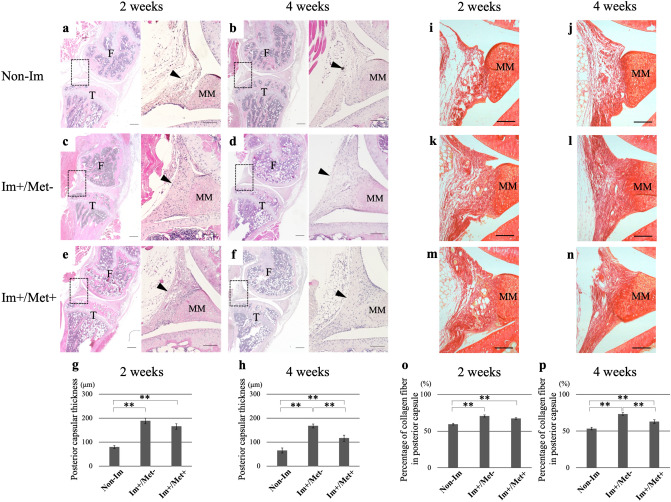
Figure 2.
Histological analysis of the effect of metformin on joint capsular fibrosis. Hematoxylin and eosin-stained sections of the knee joints for each group at 2 and 4 weeks (a–f). The arrowhead indicates the posterior capsule. Each right-side image in (a–f) shows the high magnification image of the dotted box of its corresponding left side image (Scale bar: 300 μm (right), 100 μm (left)). Posterior capsular thickness at (g) 2 weeks and (h) 4 weeks. Picrosirius red-stained sections of the posterior joint capsules for each group at 2 and 4 weeks (i–n) (Scale bar: 100 μm). Percentage of collagen fiber in the posterior capsule at (o) 2 weeks and (p) 4 weeks measured as the ratios of the total areas stained red by picrosirius red staining to the areas of the posterior capsule. Data are expressed as the mean ± standard errors. **p < 0.01; n = 8. F femur, T tibia, MM medial meniscus, Non-Im mice with non-immobilized knees, Im+/Met− mice with immobilized knees but no metformin, Im+/Met+ mice with immobilized knees who were administered metformin.

