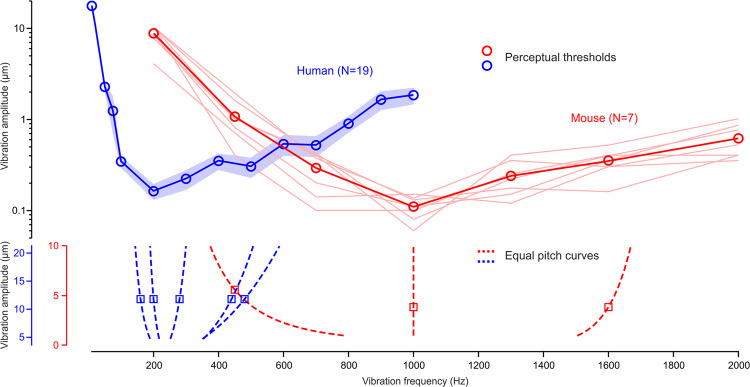
Fig. 3. V-shaped perceptual sensitivity curves.
Amplitude thresholds as a function of vibration frequency for mouse (shaded lines: individual mice, symbols: mean) and human (mean ± s.e.m.). The equal-pitch curves for all tested center/reference frequencies are replotted in the bottom panel illustrating that vibratory pitch perception shifts, with increases in amplitude, toward the frequency of highest vibrotactile sensitivity in both mouse (red) and human (blue).

