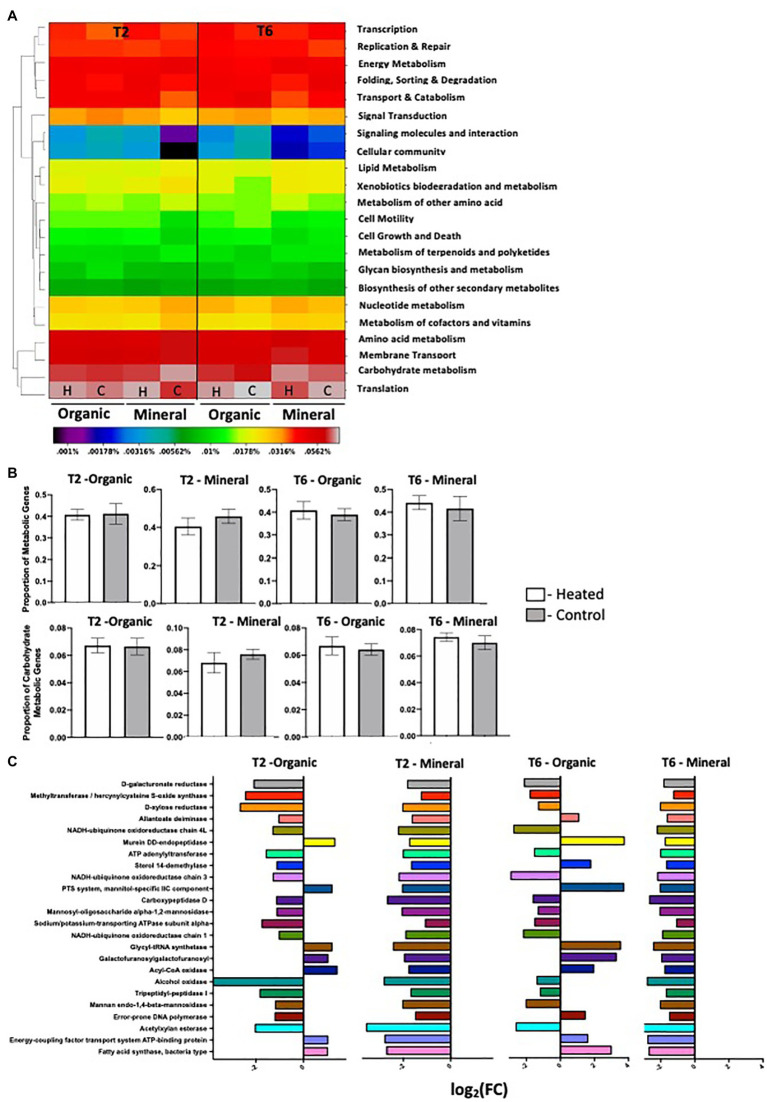
Figure 2.
KEGG annotations – (A) heat map showing the mean relative abundances of major KEGG categories in annotated transcripts across all eight treatment groups (H-Heated; C-Control). The dendrogram clusters the categories by common expression patterns using a two-way hierarchical clustering using the complete linkage method; (B) Mean relative abundances of transcripts annotated in KEGG metabolism category (Top Panel) and KEGG carbohydrate metabolism division (Bottom Panel); (C) Genes that are differentially expressed between heated and control plots in organic and mineral horizons in T2 and T6 time points. Edge R analyses was done on KEGG transcripts that were annotated as genes involved in metabolism. Differential expression is measured as log of the fold change ratio (FC). So, a log2FC of +2 means twice the abundance of the gene in heated plots compared to control, while a log2FC of −2 indicates twice the abundance of the gene in control plots compared to heated. All differential expression is measured at FDR 5%. Note that +ve and −ve FC ratios are relative to the specific heated and control plots that are used in the pair-wise comparisons.

