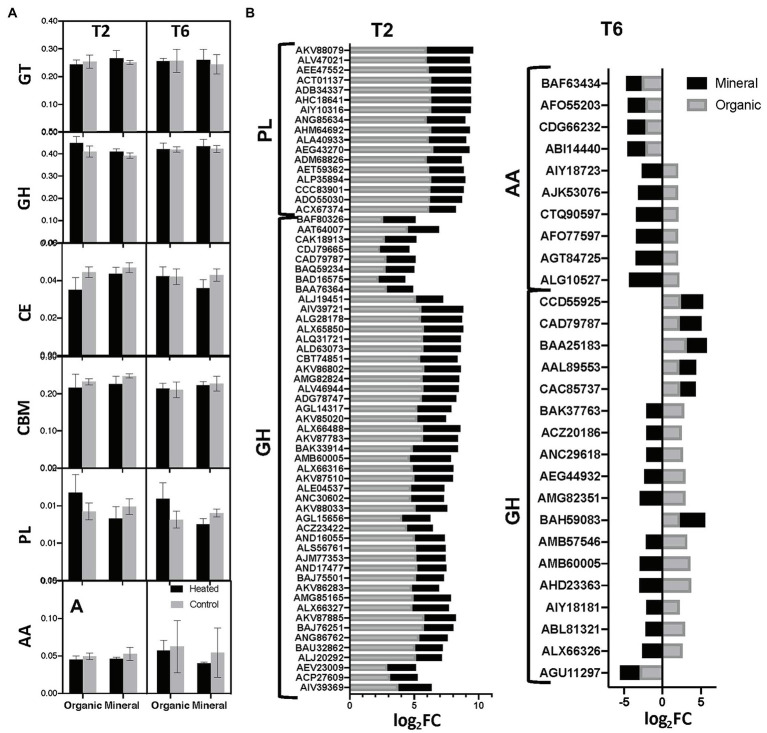
Figure 3.
Carbohydrate active enzymes annotations – (A) mean relative abundances of transcripts annotated in the six enzyme classes according to the CAZy database. CAZy family codes: GT, glycosyltranferases; GH, glycoside hydrolases; CE, carbohydrate esterases; PL, polysaccharise lyases; CBM, carbohydrate binding modules; and AA, axillary activities (oxidative enzymes); (B) Stacked plot comparing the differential expression of individual CAZy annotated genes between heated and control plots within the two most abundant enzyme classes in organic and mineral horizons in T2 and T6 time points. Differential expression is measured as log of the FC. So, a log2FC of +2 means twice the abundance of the gene in heated plots compared to control, while a log2FC of −2 indicates twice the abundance of the gene in control plots compared to heated. All differential expression is measured at FDR 5%. Note that +ve and −ve FC ratios are relative to the specific heated and control plots that are used in the pair-wise comparisons.

