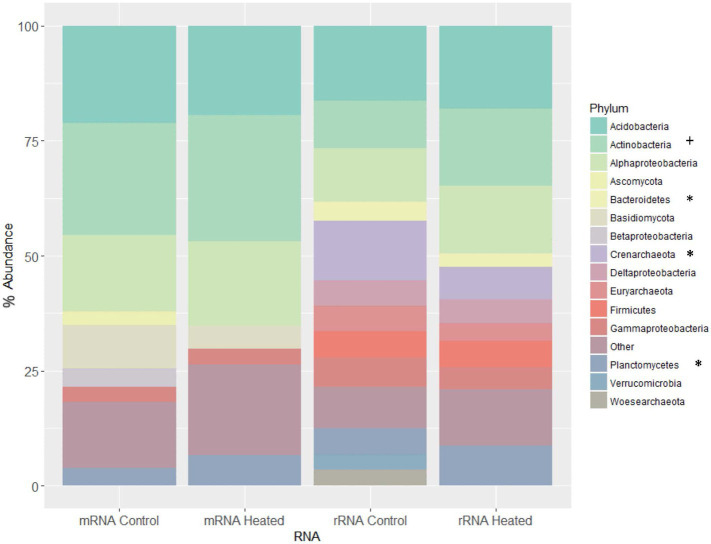
Figure 4.
Taxonomic classifications – community composition of heated and control samples using taxonomic assignments from both rRNA and mRNA reads in Organic horizon. “+” indicates enrichment and “*” depletion of phylum in heated compared to control plots. rRNA and mRNA reads were annotated using MATAM and MEGAN programs, respectively. Composition is computed using relative abundance and all assignments are given at the phylum level besides those for proteobacteria, which are at the class level. Note that assignments to eukaryotic phyla occur only for mRNA (as rRNA assignments are performed based on alignments for the 16S sequence, which occurs only in prokaryotes). Only phyla/classes occurring at >3% on average are shown and are otherwise grouped into “Other.” Only for rRNA assignments did phyla in Archaea exceed the 3% threshold for being graphed; no Archaea cleared 0.1% abundance in the mRNA samples.

