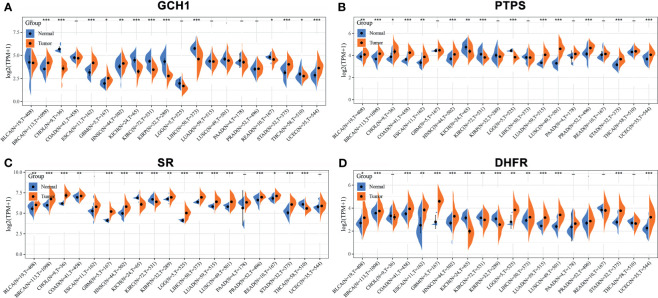
Figure 4.
The expression of BH4 metabolic enzymes in human tumors. The comparison of (A) GCH1, (B) PTPS, (C) SR and (D) DHFR expression in in various tumor tissues and corresponding normal tissues. And BH4 metabolic enzymes generally overexpress in tumor tissues than corresponding normal tissues. *P < 0.05, **P < 0.01 and ***P < 0.001, compared with the normal tissues. Gene expression data are obtained from the Cancer Genome Atlas (TCGA) database (44). BLCA, Bladder urothelial carcinoma; BRCA, Breast invasive carcinoma; CHOL, Cholangiocarcinoma; COAD, Colon adenocarcinoma; ESCA, Esophageal carcinoma; GBM, Glioblastoma multiforme; HNSC, Head and Neck squamous cell carcinoma; KICH, Kidney Chromophobe; KIRC, Kidney renal clear cell carcinoma; KIRP, Kidney renal papillary cell carcinoma; LGG, Brain Lower Grade Glioma; LIHC, Liver hepatocellular carcinoma; LUAD, Lung adenocarcinoma; LUSC, Lung squamous cell carcinoma; PAAD, Pancreatic adenocarcinoma; PRAD, Prostate adenocarcinoma; READ, Rectum adenocarcinoma; STAD, Stomach adenocarcinoma; THCA, Thyroid carcinoma; UCEC, Uterine Corpus Endometrial Carcinoma.

