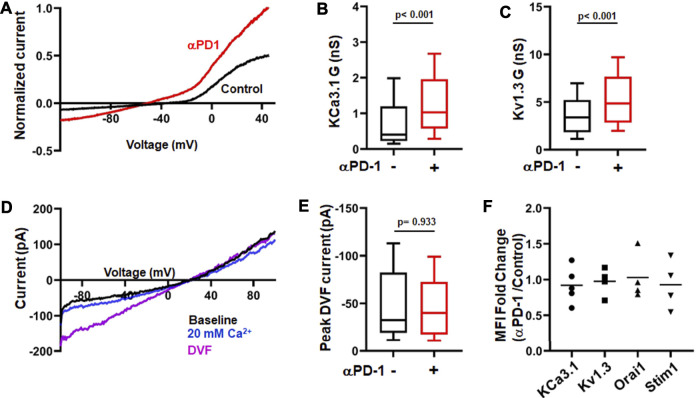
FIGURE 1.
αPD-1 treatment increases K+ channel activity in HNSCC T cells. (A) Representative current traces of KCa3.1 and Kv1.3 channels recorded in whole-cell mode of voltage-clamp configuration in activated CD8+ PBTs cells from a HNSCC patient in absence or presence of αPD-1 (10 μg/ml, for 6 h). Data are normalized to maximum current at +50 mV recorded using a ramp pulse protocol from −120 mV to +50 mV for 200 ms every 15 s. The holding potential used was −70 mV. (B,C) KCa3.1 (B) and Kv1.3 (C) conductance (G) measured in the absence or presence of αPD-1 (10 μg/ml, 6 h incubation) in CD8+ PBTs of HNSCC patients (n = 68 cells without pembrolizumab and n = 55 cells with pembrolizumab from 14 patients). (D) Representative current traces of divalent free current (DVF) through CRAC channels recorded in whole-cell mode of voltage-clamp configuration in activated CD8+ PBTs from a HNSCC patient. Data were recorded using a ramp pulse protocol from −100 to +100 mV with at holding potential of +30 mV every 1.5 s. Cells were perfused with 0 mM Ca2+ solution (1 min) followed by 20 mM Ca2+ (1 min) and DVF solutions (2 min, see methods) to amplify currents during recordings. (E) Peak DVF current values measured in absence and presence of αPD-1 (10 μg/ml, 6 h incubation) in CD8+ PBTs of HNSCC patients (n = 34 cells without αPD-1 and n = 31 cells with αPD-1 from 8 patients). The values in panels (B,C) and (E) are represented as box plots: the horizontal line indicates the median; the lower box is the 25th percentile; the upper box is the 75th percentile; and the whiskers represent the 10th and 90th percentiles. (F) Ion channel expression (KCa3.1, Kv1.3, Orai1 and STIM1) in HNSCC patient T cells after treatment with αPD-1 (10 μg/ml for 6 h). Effect of αPD-1 treatment is shown as ratio of mean fluorescence intensity (MFI, fold change) values of treatment versus control group. Data are represented as scatter plot where each symbol represents an individual patient (n = 4–5). Horizontal line represents mean values for each group. Data in panels (B,C,E) were analyzed by Mann-Whitney rank sum test.

