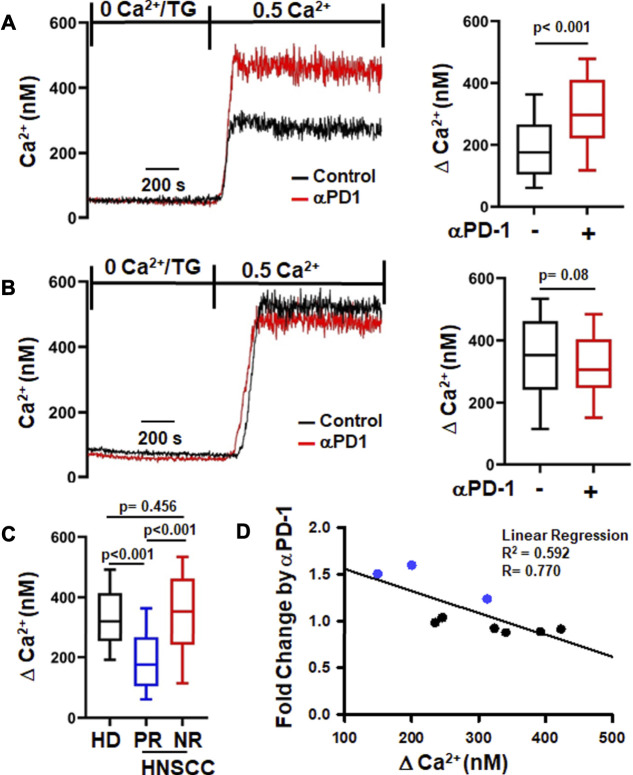
FIGURE 2.
αPD-1 increases Ca2+ fluxes in PBTs of a subset of HNSCC patients. (A,B) Representative intracellular Ca2+ recordings in activated CD8+ PBTs of HNSCC patients are shown on the left side. Cells loaded with Fura-2 were perfused with thapsigargin (TG) in 0 mM Ca2+. Perfusion with 0.5 mM Ca2+ yields a rapid influx of Ca2+ (See Material and Methods). Two types of Ca2+ responses to αPD-1 were observed. A significant increase in Ca2+ after αPD-1 (10 μg/ml for 6 h) was defined as positive response, PR (A, left) while no change in Ca2+ response was defined as no-response, NR (B, left). The subset of HNSCC patients (n = 3/9) showing positive Ca2+ response are reported in panel (A, right) while patients (n = 6/9) with no-response are shown in panel (B, right). The corresponding single cell ∆Ca2+ values (peak minus baseline before peak) measured in the absence and presence of αPD-1 of PR and NR are shown in the right panels (n = 82–99 cells from 3 patients in PR and n = 140–149 cells from 6 patients in NR). (C) Comparison of ∆Ca2+ values of activated CD8+ PBTs from HDs n = 376 cells from nine donors and PR (n = 82 cells from 3 patients) and NR (n = 146 cells from 6 patients) HNSCC patients at baseline (before αPD-1). The ∆Ca2+ values in panels (A,B,C) are represented as box and whisker plots. The lower and upper bound of the box represent 25th and 75th percentiles respectively. Median values are shown as horizontal line in the box. The lower and upper error represents 10th and 90th percentile respectively. (D) Relationship between ∆Ca2+ values before αPD-1 treatment and fold increase in ∆Ca2+ after treatment with αPD-1 antibody in CD8+ PBTs of HNSCC patients (n = 9) are represented as correlation analysis. Individual patients from PR and NR group are marked in blue (PR) and black (NR). Data for panel (A) were analyzed using unpaired student’s t-test. Data for panel (B) were analyzed using Mann-Whitney rank-sum test. Data in panel C were analyzed using ANOVA (p < 0.001) followed by Dunn’s test and data in panel D were analyzed using linear regression.

