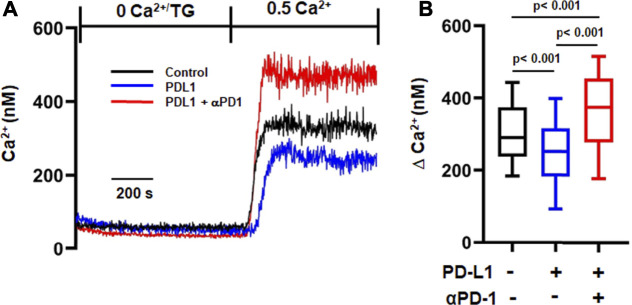
FIGURE 4.
αPD-1 rescues the reduced Ca2+ influx induced by PDL-1-Fc in HDs. (A) Representative traces of intracellular Ca2+ response in activated CD8+ PBTs of HDs. Cells were loaded with Fura-2 and Ca2+ fluxes were elicited by TG/0 mM Ca2+ followed by 0.5 mM Ca2+ (See Material and Methods). Cells were incubated with plate bound PD-L1 (PD-L1-Fc, 10 μg/ml for 72 h) followed by treatment with αPD-1 (10 μg/ml for 6 h). (B) Summary of ∆Ca2+ values of activated CD8+ PBTs of HDs (n = 160–255 cells from nine HDs, 20–50 cells were recorded from a single HD, see Methods). The values in panel B are represented as box and whisker plots. The lower and upper bound of the box represent 25th and 75th percentiles respectively. Median values are shown as horizontal line. The lower and upper error bars represents 10th and 90th percentile respectively. Data were analyzed using ANOVA (p < 0.001) on ranks followed by Dunn’s post hoc analysis.

