FIGURE 6.
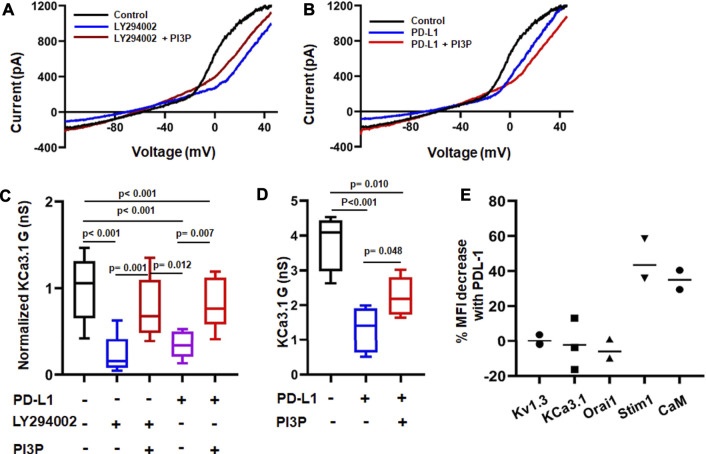
Differential time-dependent involvement of PI3K and calmodulin on PD-L1 mediated inhibition of KCa3.1 channels. (A,B) Representative recordings of KCa3.1 channels in activated CD8+ PBTs from HDs showing the effect of the PI3K inhibitor LY294002 (10 µM) +/− phosphatidylinositol-3 phosphatase (PI3P) (100 nM) (A) and PD-L1 (PD-L1-Fc, 10 μg/ml) +/− PI3P (100 nM) (B). (C) Summary of the pharmacological modulation of KCa3.1 channels byLY294002 and PI3P in the absence and presence of plate bound PD-L1 in activated CD8+ PBTs of HDs. Cells were activated using anti-CD3/CD28 antibodies for 72 h. Cells were perfused with LY294002 for 15 min followed by patch clamp recordings with and without PI3P, delivered intracellularly via patch pipette (n = eight to nine cells per group from 3 HDs). All KCa3.1 conductance (G) values are normalized to the average G of the control group (drug-free). (D) KCa3.1 G measured in absence or presence of PD-L1 in activated CD8+ PBTs of HDs. Cells were treated with plate-bound PD-L1 (PD-L1-Fc, 10 μg/ml) and activated using anti-CD3/CD28 antibodies for 120 h PI3P was delivered intracellularly via the patch pipette during the electrophysiological experiments (drug-free control). Cells were held at −70 mV, n = four to five cells per group from one HD. The values in panel (C,D) are represented as box and whiskers plot. The lower and upper bound of the box represent 25th and 75th percentiles respectively. Median values are shown as horizontal line. The lower and upper error bars represents 10th and 90th percentile respectively. (E) Percentage change in mean fluorescence intensity (MFI) of ion channels (Kv1.3, KCa3.1, Orai1, Stim1) and Calmodulin (CaM) measured using flow cytometry. Each dot represents an individual HD and the horizontal black line represents the mean value. Data in panel (C) were analyzed by One Way ANOVA (p < 0.001) followed by Holm-Sidak’s post hoc analysis. Data in (D) were analyzed by One way ANOVA followed by Holm-Sidak’s post hoc analysis.

