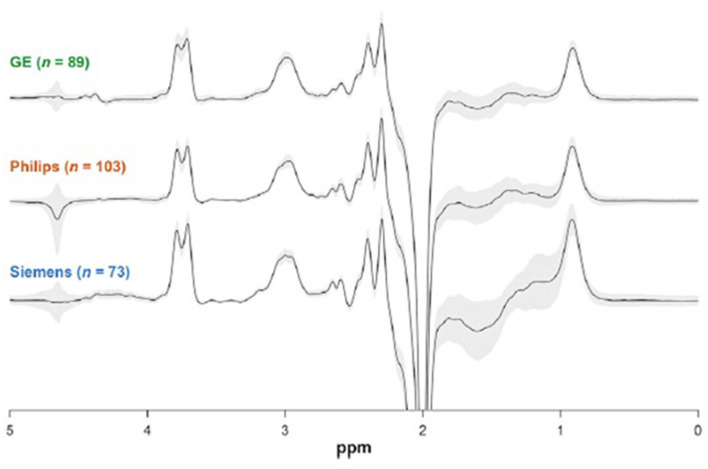
Figure 4.
3.0 T GABA J edited spectra of controls obtained at 24 different sites using MRI systems from 3 vendors. The similarity between the spectra explains the high reproducibility found between sites, with a 12% coefficient of variation. Each spectrum shown is the overlay of all the spectra obtained from a vendor, and demonstrates the small coefficient of variation. This figure is adapted from Figure 2 from Mikkelsen et al. (36) with permission.

