
Figure 4.
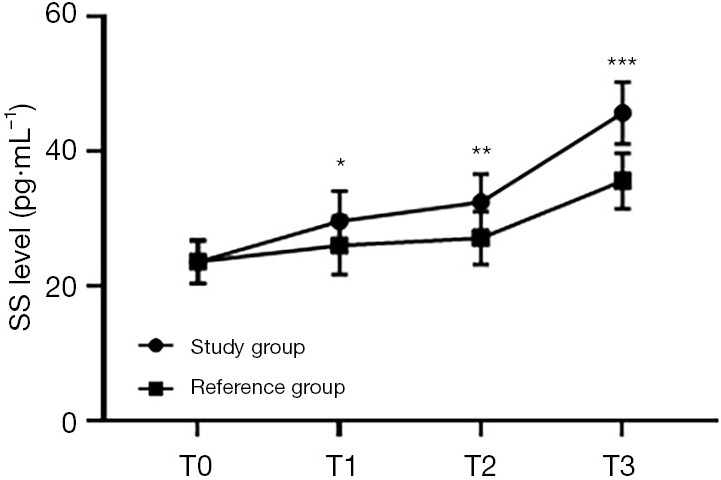
Comparison of SS levels at different time points between the 2 groups (). The abscissa represents T0, T1, T2, and T3, while the ordinate represents the SS level. The SS levels at T0, T1, T2, and T3 in the study group were 23.56±3.17, 29.62±4.51, 32.46±4.18, and 45.72±4.57 pg/mL, respectively. The SS levels at T0, T1, T2, and T3 in the reference group were 23.63±3.21, 26.02±4.31, 27.11±3.91, and 35.61±4.21 pg/mL, respectively. *, indicates that there were significant differences in the SS levels at T1 between the 2 groups (t=4.544; P<0.000). **, indicates that there were significant differences in the SS levels at T2 between the 2 groups (t=7.360; P=0.000). ***, indicates that there were significant differences in the SS levels at T3 between the 2 groups (t=12.812; P=0.000).