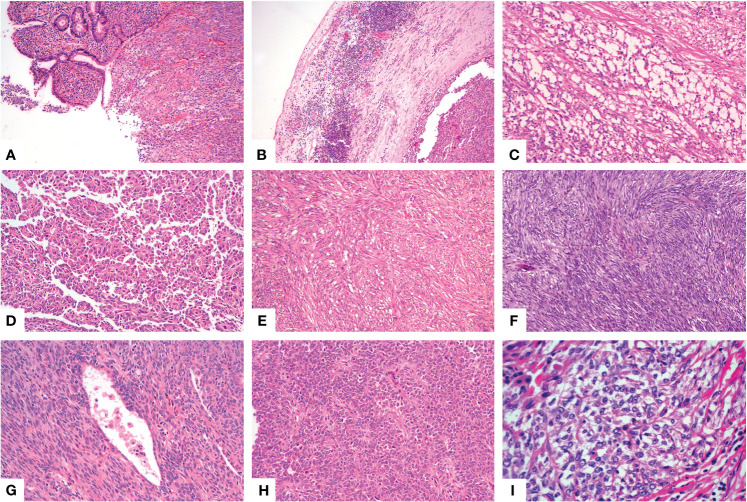
Figure 1.
Histological findings of GNET. Low power view shows a sheet like pattern with ulceration on the surface [(A), X100]. Patchy lymphocytic infiltration and multiple lymphoid follicles were observed in the tumor border near the serosa [(B), X100]. The neoplastic cells arranged in microcystic [(C), X200], papillary [(D), X100], fascicular [(E), X100], palisade [(F), X100], pseudoalveolar [(G), X200] or rosette like [(H), X200] pattern with eosinophilic cytoplasm. Some areas showed epithelioid cells with clear cytoplasm [(I), X400].

