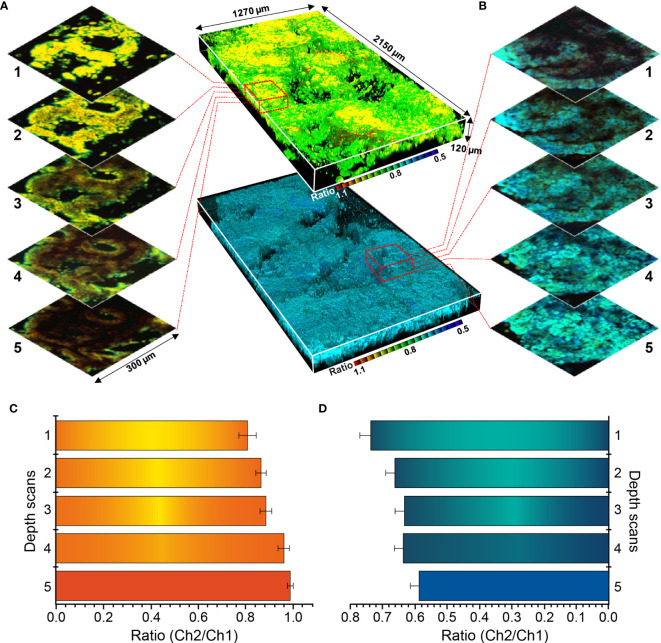
Figure 8.
Three-dimensional pseudocolored ratiometric two-photon microscopy images (Ch2/Ch1) of normal and cancer tissue using SE1. (A) Sectional images of SE1 in normal tissue. (B) Sectional images of SE1 in cancerous tissue. (C) Ratio value of each section at varying depths in normal tissue. (D) Ratio value of each section at varying depths in cancerous tissue. The red boxed area in panels (B, C) are enlarged to show images by depth. Maximum and minimum values are illustrated using error bars.

