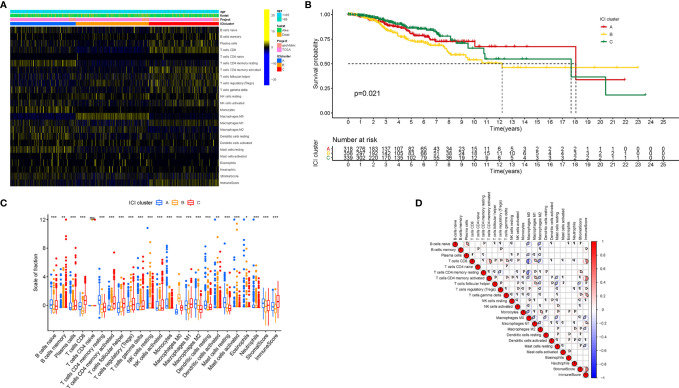
Figure 1.
The Landscape of Immune Cell Infiltration in the TIME context. (A) Unsupervised clustering of tumor-infiltrating immune cells in BRCA patients. Rows represent tumor-infiltrating immune cells, and columns represent samples. (B) Kaplan-Meier curves for the overall survival (OS) of all BRCA patients in discrete ICI clusters. (C) The subpopulation of infiltrating immune cells, immune score, and stromal score in three ICI clusters. (D) Intrinsic connection of the infiltrating immune cells and immune scores. The asterisks represented the statistical p value (*P < 0.05; **P < 0.01; ***P < 0.001), ns, No Significance.

