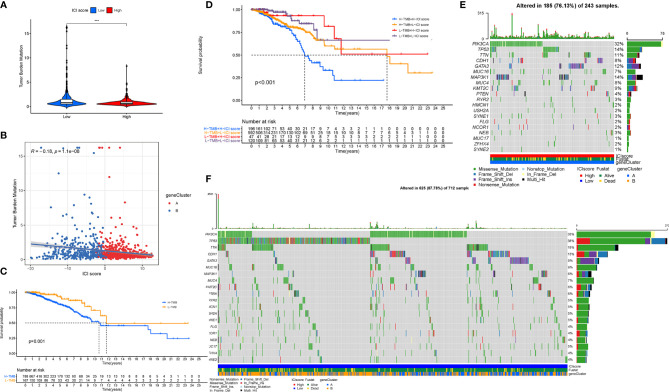
Figure 10.
The Correlation between the ICI Score and TMB. (A) Difference of TMB between patients from the low-/high-ICI score subgroups. (B) Scatterplots depicting the negative correlation between the ICI scores and TMB. (C) Kaplan-Meier curves for the high and low TMB groups. (D) Kaplan-Meier curves for patients stratified by both TMB and ICI scores. The oncoPrint was constructed using the high ICI scores (E) and low ICI scores (F). The asterisks represented the statistical p value (***P < 0.001).

