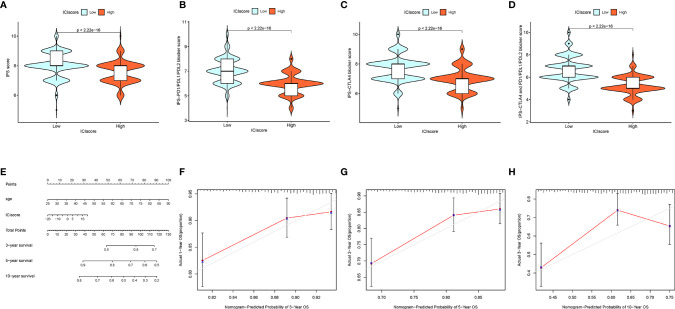
Figure 9.
The Estimation of the ICI Score in Immunotherapy Response. (A) IPS score distribution plot. (B) IPS–CTLA4 blocker score distribution plot. (C) IPS–PD1/PDL1/PDL2 blocker score distribution plot. (D) IPS–CTLA4 and PD1/PDL1/PDL2 blocker score distribution plot. (E) Nomogram was assembled by age and risk signature for predicting survival of BRCA patients. (F) Three‐year nomogram calibration curves of the combination of the TCGA and GEO cohorts. (G) Five‐year nomogram calibration curves of the combination of the TCGA and GEO cohorts. (H) Ten‐year nomogram calibration curves of the combination of the TCGA and GEO cohorts.

