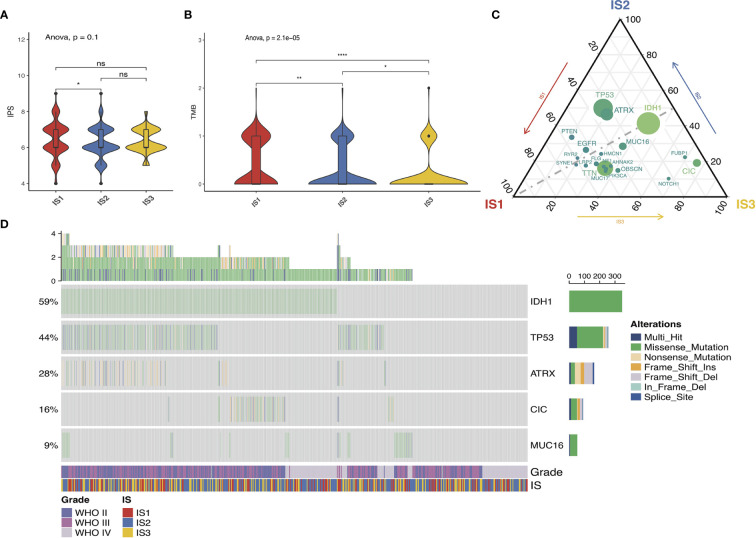
Figure 5.
Association between immune subtypes and mutation. IPS and TMB in IS1–IS3 across TCGA (A, B). Distribution of top 20 mutated genes among three immune subtypes in the TCGA (C) database. Seven highly mutated genes in glioma immune subtypes in TCGA (D) dataset. ns presents no difference, *p < 0.05, **p < 0.01, and ****p < 0.0001.

