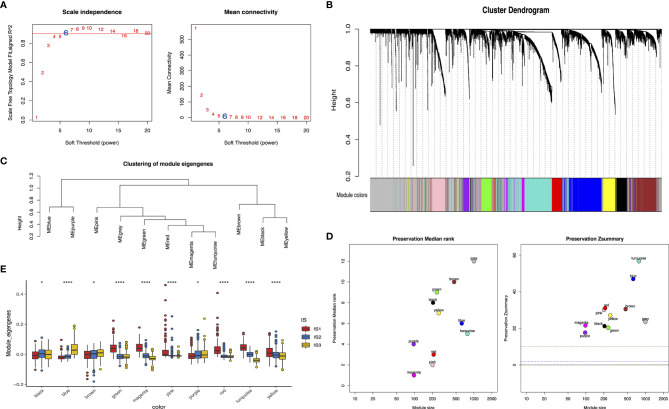
Figure 9.
Identification of immune gene coexpression modules of glioma. Scale-free fit index for various soft-thresholding powers (β) and mean connectivity for various soft-thresholding powers (A). Dendrogram of all differentially expressed genes clustered based on a dissimilarity measure (1-TOM) (B). Module eigengenes clustering tree (C). Module preservation statistics of gene modules. The x-axis presents the module size as the y-axis presents the preservation median rank or preservation Z-summary (D). Differential distribution of MEs of each module in glioma subtypes (E). *p < 0.05 and ****p < 0.0001.

