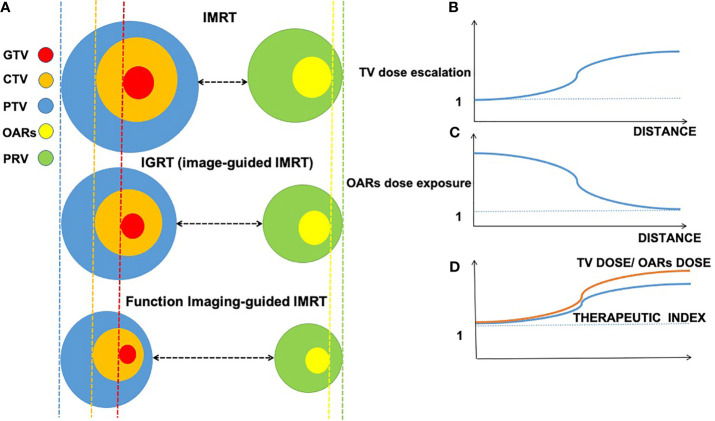
Figure 1.
Interaction among imaging-guided techniques, treatment margins of tumor target, and organs at risk (OARs) based on the accuracy of imaging approaches. Decreasing volume around gross tumor volume (GTV, in red), clinical target volume (CTV, in orange), planning target volume (PTV, in blue), planning organ at risk volume (PRV, in green), and organs at risk (OARs, in yellow); distance changes between treatment margins and OARs in intensity-modulated radiation therapy (IMRT), image-guided radiation therapy (IGRT), and function imaging-guided IMRT. (A) Relations between distance (x-axis) of gross target and organ at risk. (B) Relations between the distance (x-axis) and TV dose escalation (y-axis). (C) Relations between the distance (x-axis) and OARs dose exposure (y-axis). (D) Relations between TV dose/OARs dose and therapeutic index.

