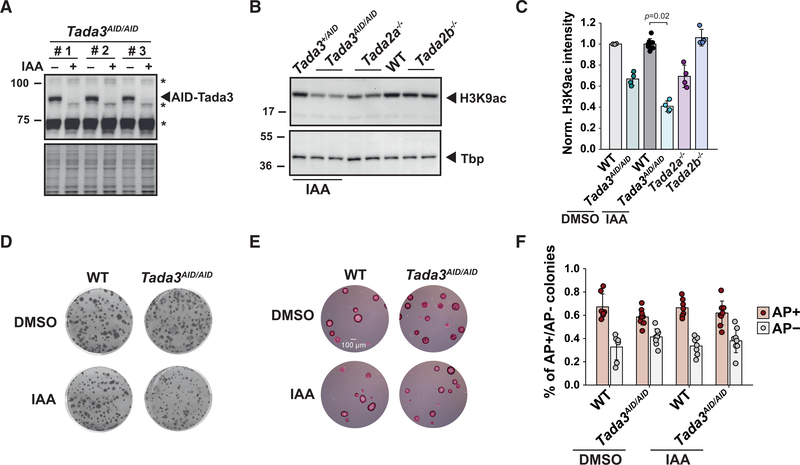
Figure 3. Loss of the shared acetyltransferase activity of SAGA and ATAC does not affect proliferation or self-renewal of mouse ESCs.
(A) Western blot analyses of protein extracts prepared from three Tada3AID/AID cell lines treated with (+) or without (−) IAA for 24 h. *, unspecific bands.
(B) Western blot analyses of histone H3 lysine 9 acetylation (H3K9ac) levels in extracts prepared from Tada2a−/−, Tada2b−/−, and Tada3AID/AID cells treated for 24 h with IAA. Control cells are either heterozygous Tada3+/AID or WT cells. Tbp serves as loading control.
(C) Quantification of H3K9ac levels normalized to Ponceau staining. Error bars show mean ± SD of at least 4 biological replicates using at least two independent clones. Only statistically significant (p < 0.05) results are indicated. Statistical test performed is Wilcoxon rank-sum test with Benjamini-Hochberg correction for multiple testing.
(D and E) Clonal assays of Tada3AID/AID and WT cells cultured in FCS+LIF (D) or FCS+LIF+2i (E) medium treated with DMSO or IAA and stained with crystal violet (D) or AP (E). Scale bar represents 100 μm.
(F) Quantification of AP staining of clonal assays as shown in (D), normalized as in Figure 1F. Error bars show mean ± SD of 8 biological replicates. At least two independent clones were analyzed per cell line. Statistical test performed is two-sided Wilcoxon-Mann-Whitney test. No statistically significant (p < 0.05) differences were detected. See also Figure S3.

