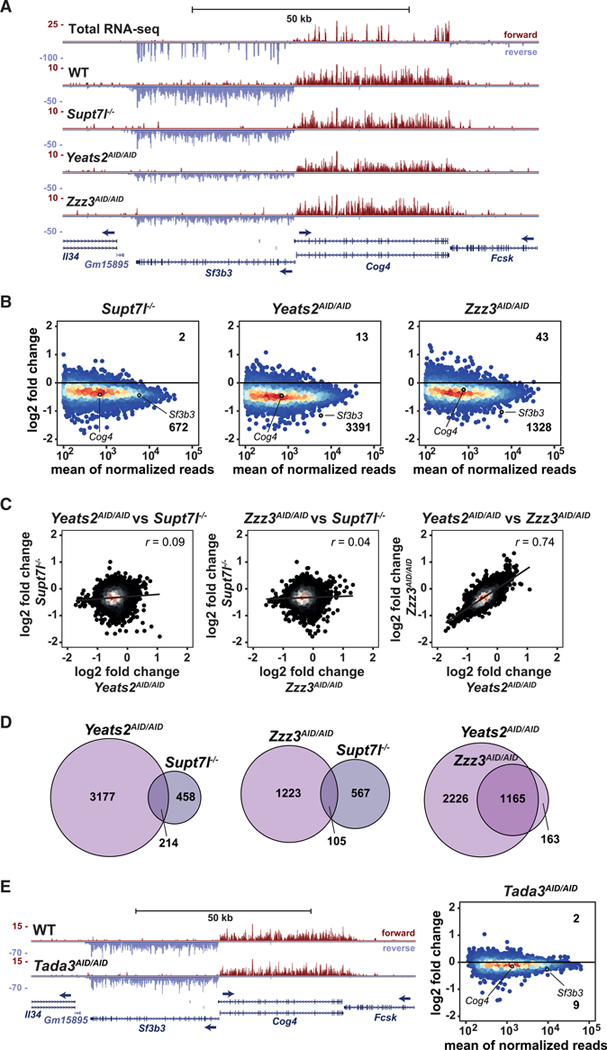
Figure 4. SAGA and ATAC regulate the expression of different sets of genes.
(A) Genome browser view showing newly synthesized mRNA sequencing coverage of Sf3b3 and Cog4 in Supt7l−/−, Yeats2AID/AID, and Zzz3AID/AID cell lines compared with WT cells. The top panel shows total RNA-seq coverage in WT cells. Blue arrows indicate transcription direction.
(B) MA plots showing log2 fold changes (log2 FCs) of newly synthesized mRNA levels in Supt7l−/−, Yeats2AID/AID, and Zzz3AID/AID cell lines relative to WT cells against the mean of normalized reads. For each cell line, two independent clones were treated for 24 h with IAA. Numbers of significantly up- and downregulated genes are indicated. An adjusted p value of 0.05 and absolute log2 FC of 0.5 were used as thresholds for significantly affected genes.
(C) Correlation analyses of log2 FCs of newly synthesized mRNA between Supt7l−/−, Yeats2AID/AID, and Zzz3AID/AID lines.
(D) Venn diagrams comparing overlaps of significantly downregulated genes between Supt7l−/−, Yeats2AID/AID, and Zzz3AID/AID cells.
(E) Left, genome browser view showing newly synthesized mRNA sequencing coverage of Sf3b3 and Cog4 in WT and Tada3AID/AID cells treated with IAA for 24 h. Right, MA plot showing log2 FCs of newly synthesized mRNA levels in Tada3AID/AID cells relative to WT cells treated with IAA. See also Figure S4.

