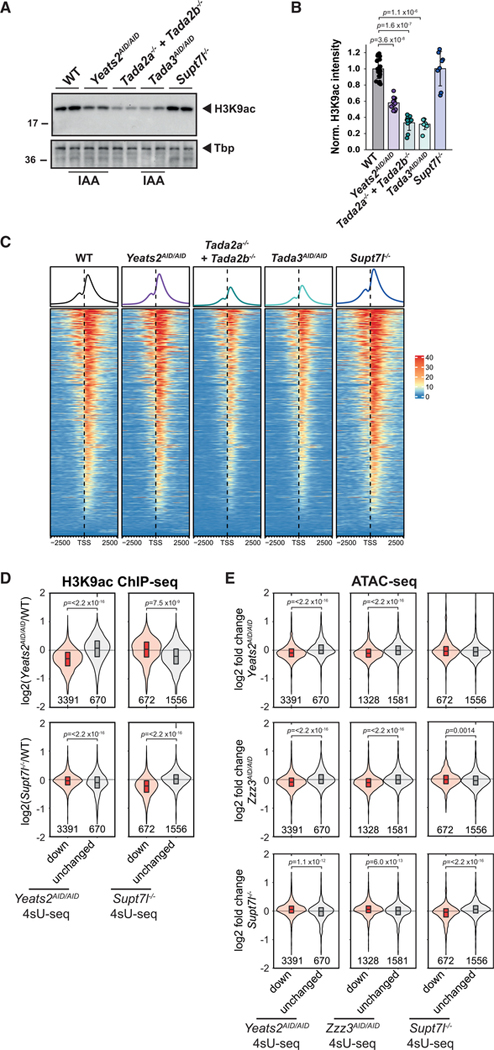
Figure 5. H3K9ac and chromatin accessibility are decreased at ATAC- and SAGA-dependent genes.
(A) Representative images of western blot analyses of H3K9ac levels in extracts prepared from WT, Yeats2AID/AID, Tada2a−/−+Tada2b−/−, Tada3AID/AID, and Supt7l−/− cells. AID cells were treated for 24 h with IAA. Tbp serves as loading control.
(B) Quantification of H3K9ac levels normalized to Ponceau staining. Error bars show mean ± SD of at least 6 biological replicates using at least two independent clones.
(C) Heatmap representation of H3K9ac ChIP-seq coverage in WT, Yeats2AID/AID, Tada2a−/−+Tada2b−/−, Tada3AID/AID, and Supt7l−/− cells over promoter regions of 8,201 genes considered as expressed based on 4sU-seq. TSS, transcription start site.
(D) Violin plots showing log2 FC of H3K9ac ChIP-seq coverage at promoters between Yeats2AID/AID (top panels) or Supt7l−/− cells (bottom panels) and WT cells for either genes found significantly downregulated (red) or unchanged (gray, absolute log2 FC < 0.2 and an adjusted p value > 0.2) by 4sU-seq in either Yeats2AID/AID (left panels) or Supt7l−/− cells (right panels). Numbers of genes per category are indicated below each violin graphs.
(E) Violin plots showing log2 FC of ATAC-seq coverage at promoters for genes which were found either downregulated (red) or unchanged (gray) in the respective 4sU-seq experiments. Statistical test performed in (B) is Wilcoxon rank-sum test with Benjamini-Hochberg correction for multiple testing and in (D) and (E) is two-sided Welch t test. Only statistically significant results (p < 0.05) are indicated. See also Figure S5.

