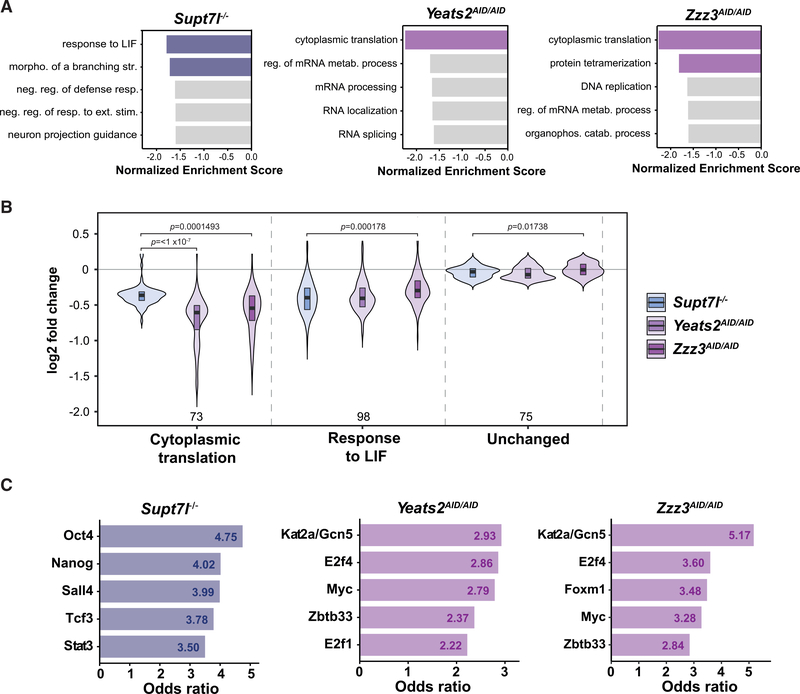
Figure 6. Gene categories preferentially regulated by SAGA and ATAC.
(A) Gene set enrichment analyses (GSEAs) for Gene Ontology (GO) biological processes based on log2 FCs in newly synthesized RNA levels from Supt7l−/−, Yeats2AID/AID, and Zzz3AID/AID cells relative to WT cells. Colored bars represent statistically significant terms (false discovery rate [FDR] < 0.05), while non-significant terms are represented in gray.
(B) Violin plots of log2 FCs comparing the distribution of expression changes of genes belonging to the GO categories “cytoplasmic translation” (73 genes) and “response to LIF” (98 genes) to unchanged genes (75 genes). Statistical test performed is ANOVA test. Only statistically significant results (p < 0.05) are indicated.
(C) Transcription-factor-binding sites from ChEA and Encode ChIP datasets enriched in genes significantly downregulated in Supt7l−/−, Yeats2AID/AID, and Zzz3AID/AID cell lines as identified by Enrichr. Only the first five transcription factors with the highest odds ratio and adjusted p value < 0.05 are shown.

