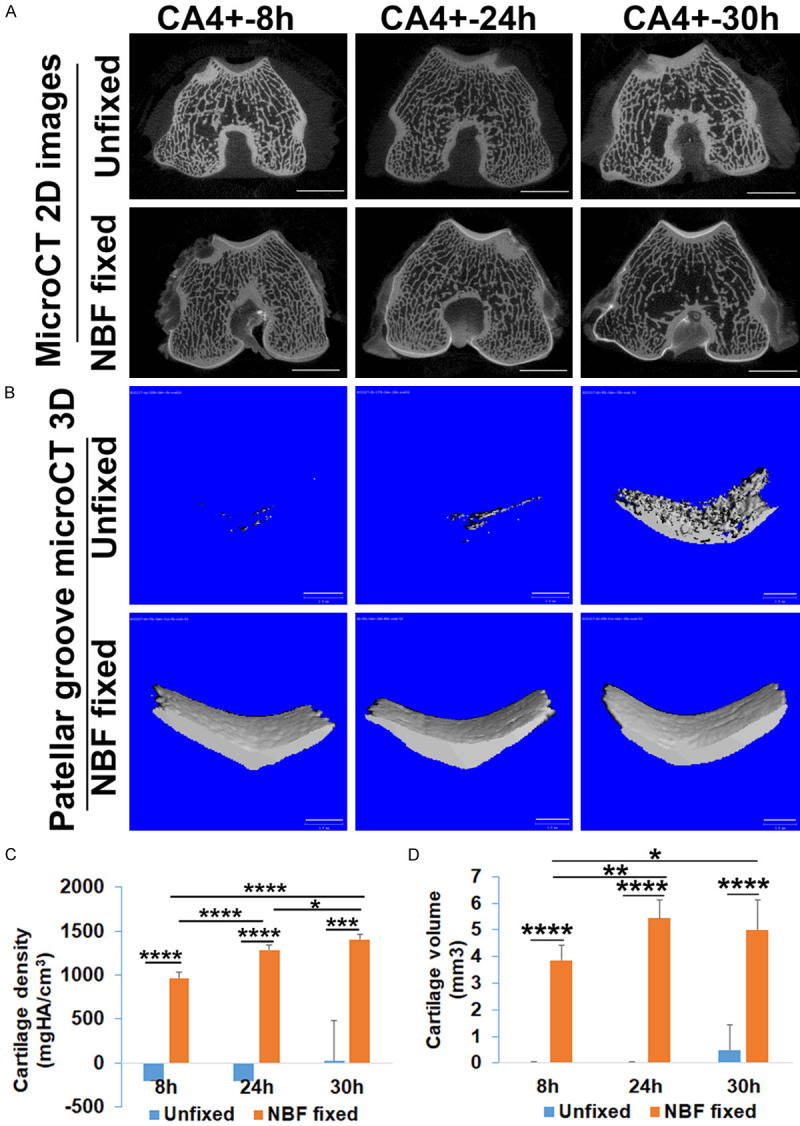
Figure 3.

The stability of CA4+ CECT after PBS soaking. A. 2D microCT images showed significant signal decrease in the cartilage of unfixed tissues at 8 and 24 hours of incubation time at both the groove and condyle locations. The cartilage in the 30-hour group also showed intensity reduction. In contrast, the cartilage of the NBF fixed groups showed no decrease in signal with a more distinguishable interface between articular cartilage and subchondral bone. Scale bars = 5 mm. B. MicroCT 3D images of 50 slices of patellar groove cartilage. The signal of cartilage in unfixed tissues significantly diminished with faint visible cartilage when using the same threshold as for fresh labeled cartilage. In contrast, NBF fixed cartilage demonstrates intense cartilage image morphology. Scale bars = 1 mm. C. Cartilage densities are significantly higher in NBF fixed tissues than unfixed tissues. *P<0.05, ***P<0.001. D. Cartilage volumes are significantly higher in NBF fixed cartilage than those in unfixed cartilage at all tested time points. *P<0.05, **P<0.01, ****P<0.0001.
