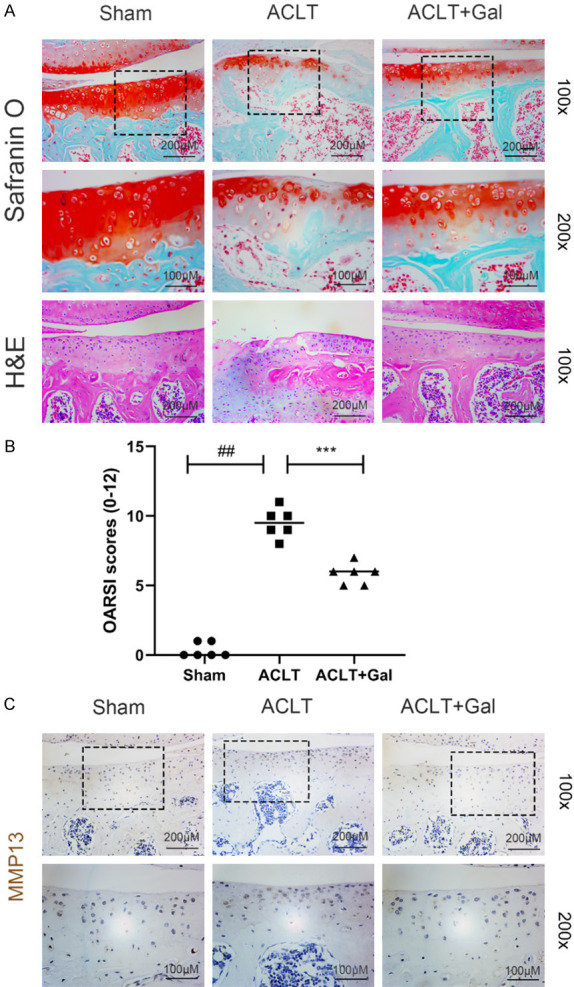
Figure 6.

Galangin ameliorated OA progression in mouse ACLT model. A. Representative H&E and Safranin O staining of the cartilage tissues (magnification: 100× or 200×, scale bar: 100 µm or 200 µm). B. Cartilage OARSI scores. C. Immunohistochemical staining of MMP13 of the cartilage tissues (magnification: 100× or 200×, scale bar: 100 µm or 200 µm). All data are presented as mean ± SD. Significant differences among groups are indicated as ##P < 0.001 vs. sham group; ***P < 0.001 vs. ACLT group, n = 6.
