
Figure 2.
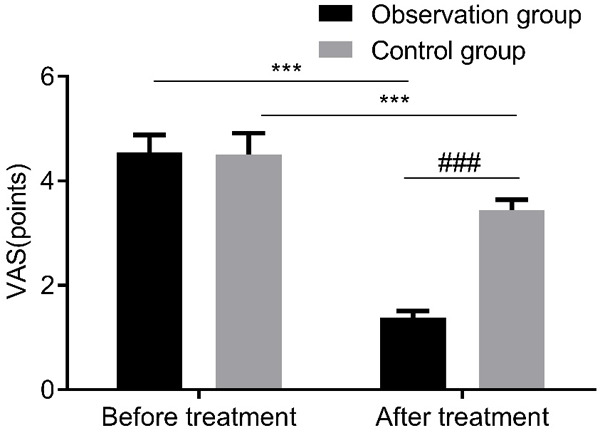
VAS scores of patients in both groups. VAS: Visual Analogue Scale. Compared with pre-treatment, ***P<0.001; compared with control group, ###P<0.001.
Official websites use .gov
A
.gov website belongs to an official
government organization in the United States.
Secure .gov websites use HTTPS
A lock (
) or https:// means you've safely
connected to the .gov website. Share sensitive
information only on official, secure websites.
VAS scores of patients in both groups. VAS: Visual Analogue Scale. Compared with pre-treatment, ***P<0.001; compared with control group, ###P<0.001.