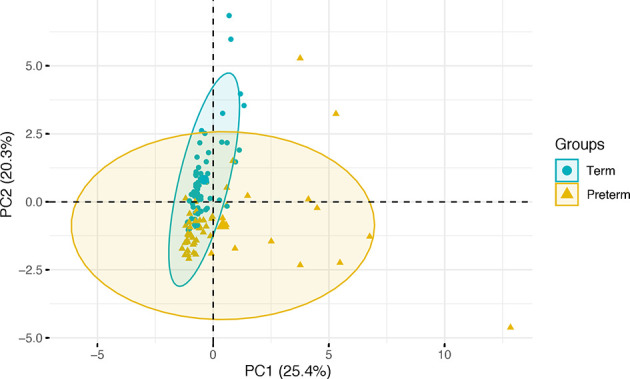
Figure 1.

Projection of individual cord blood inflammatory profiles onto the first two principal components, grouped by gestational age category. Term infants are represented in green and preterm infants in gold, with ellipses modelled on the mean and covariances of each group.
