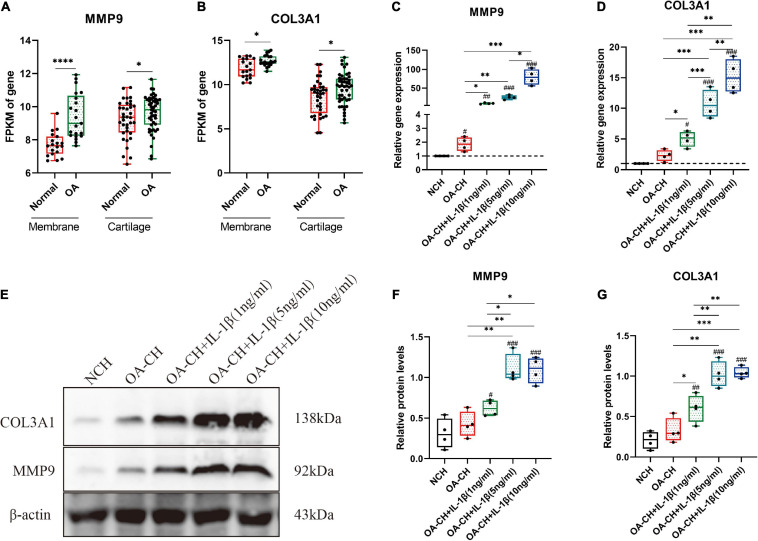
FIGURE 6.
Validation of the hub genes (COL3A1 and MMP9) by quantitative reverse transcription PCR (qRT-PCR) and Western blotting. (A,B) Fragments per kilobase of exon model per million mapped fragments (FPKM) of COL3A1 and MMP9 in synovial membrane and cartilage samples. *p < 0.05; ****p < 0.001, unpaired Student’s t-test. (C,D) Gene expression levels of COL3A1 and MMP9 in non-osteoarthritic chondrocytes (NCH) and osteoarthritic chondrocytes (OA-CH) treated with different concentrations of IL-1β. (E–G) Western blotting was used to determine the protein expression levels of COL3A1 and MMP9 in NCH and OA-CH treated with different concentrations of IL-1β. Significant difference to control (NCH): #p < 0.05; ##p < 0.01; ###p < 0.001. *Significant difference between groups: *p < 0.05; **p < 0.01; ***p < 0.001. One-way ANOVA with Newman–Keuls multiple comparison test. All values represent the mean ± standard deviation (n = 4).

