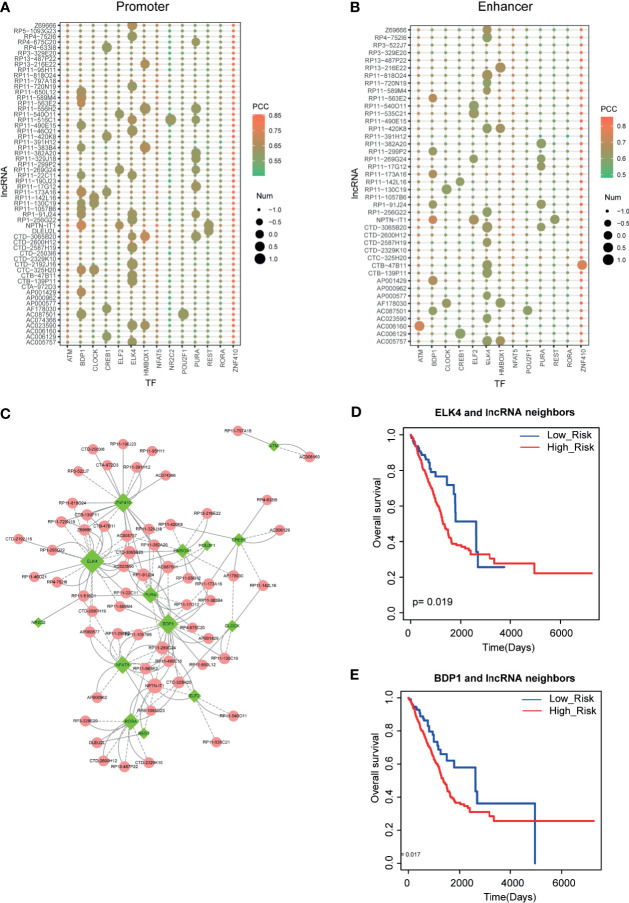
Figure 5.
Identification of lncRNA-TF positive feedback loops. (A, B) Motif scanning results of lncRNA promoter and enhancer regions. Heatmap represents the Pearson correlation coefficients between lncRNAs and TFs. Size represents the number of motifs in DNA regions. (C) Cytoscape visualization of lncRNA-TF positive feedback loops. (D, E) The prognostic effects of ELK4-lncRNA feedback pairs and BDP1-lncRNA feedback pairs in LUAD.

