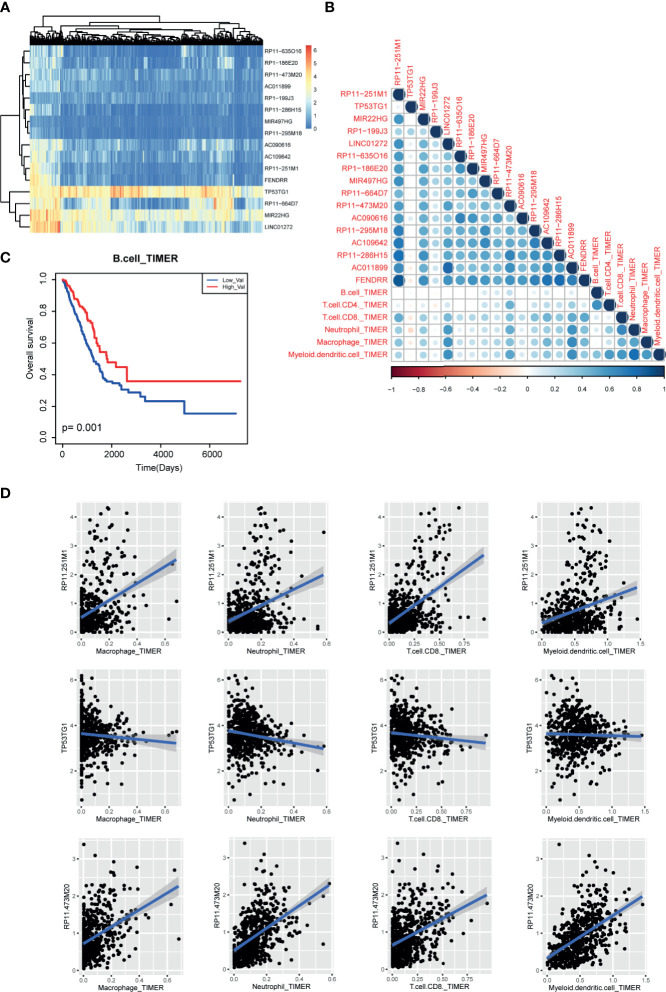
Figure 7.
Immune cell infiltration of m6A-related lncRNAs in LUAD patients. (A) The expression heatmap of m6A-related lncRNAs in TCGA LUAD cohorts. (B) The correlation heatmap of correlation coefficients between m6A regulator expression and TIMER2 immune cell estimation score. (C) The Kaplan-Meier survival curves of between B cell-enriched patients and other patients. (D) Scatter plots of correlations between m6A regulator expression and TIMER2 immune cell estimation score.

