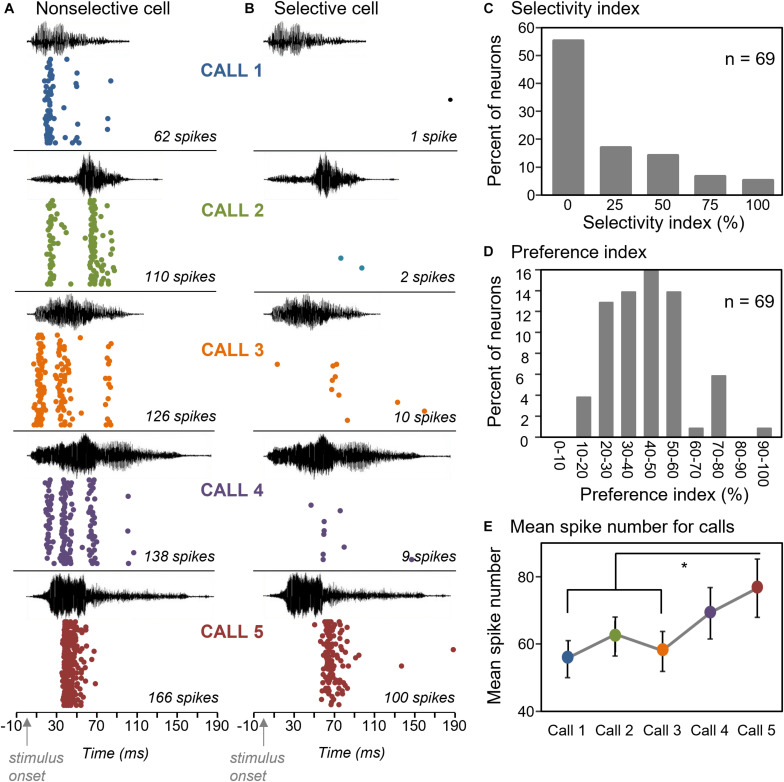
FIGURE 2.
Selectivity of IC neurons for the five BBVs. (A) Raster plots of a neuron that responded to all five BBVs. (B) Raster plot of a neuron that responded robustly only to Call 5. (C) Selectivity index across a group of 69 neurons illustrating a low degree of selectivity, with most neurons responding to all calls. (D) Preference index, showing the mean per cent difference in spiking among pairs of calls across a group of 69 neurons. (E) Mean spike counts for responses across calls show significant differences, with Calls 1 and 3 evoking fewer spikes than Call 5. *p < 0.05.

