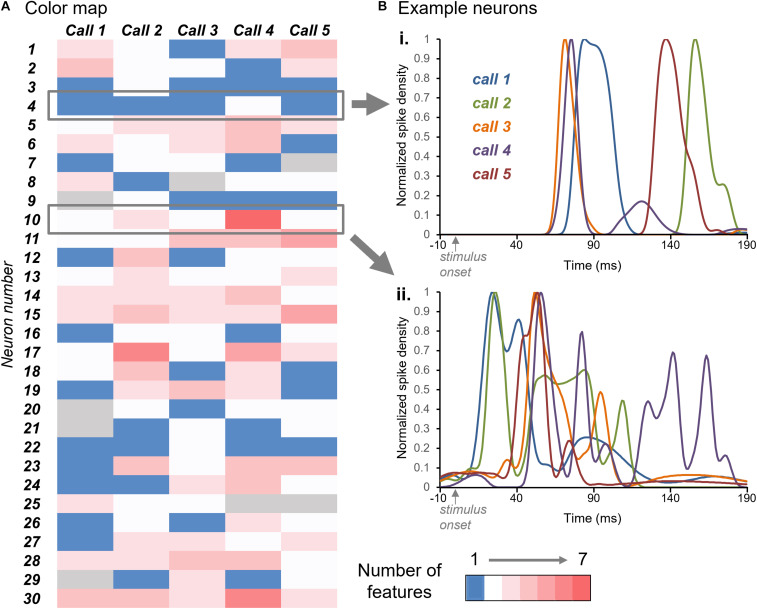
FIGURE 4.
(A) Color map of numbers of response features for the responses of 30 neurons (y-axis) across the five BBVs (x-axis). Blue indicates single response features and white through red indicate increasing numbers of features, up to seven. Gray indicates the lack of response to a specific call. (B) Normalized spike density functions for two neurons indicated by the gray boxes in (A). Spike density functions for the responses to all five calls are plotted together. For the neuron in (i), the number of response features was one for four of the calls, and two for one of the calls. For the neuron in (ii), the numbers of response peaks across calls ranged from two to seven.

