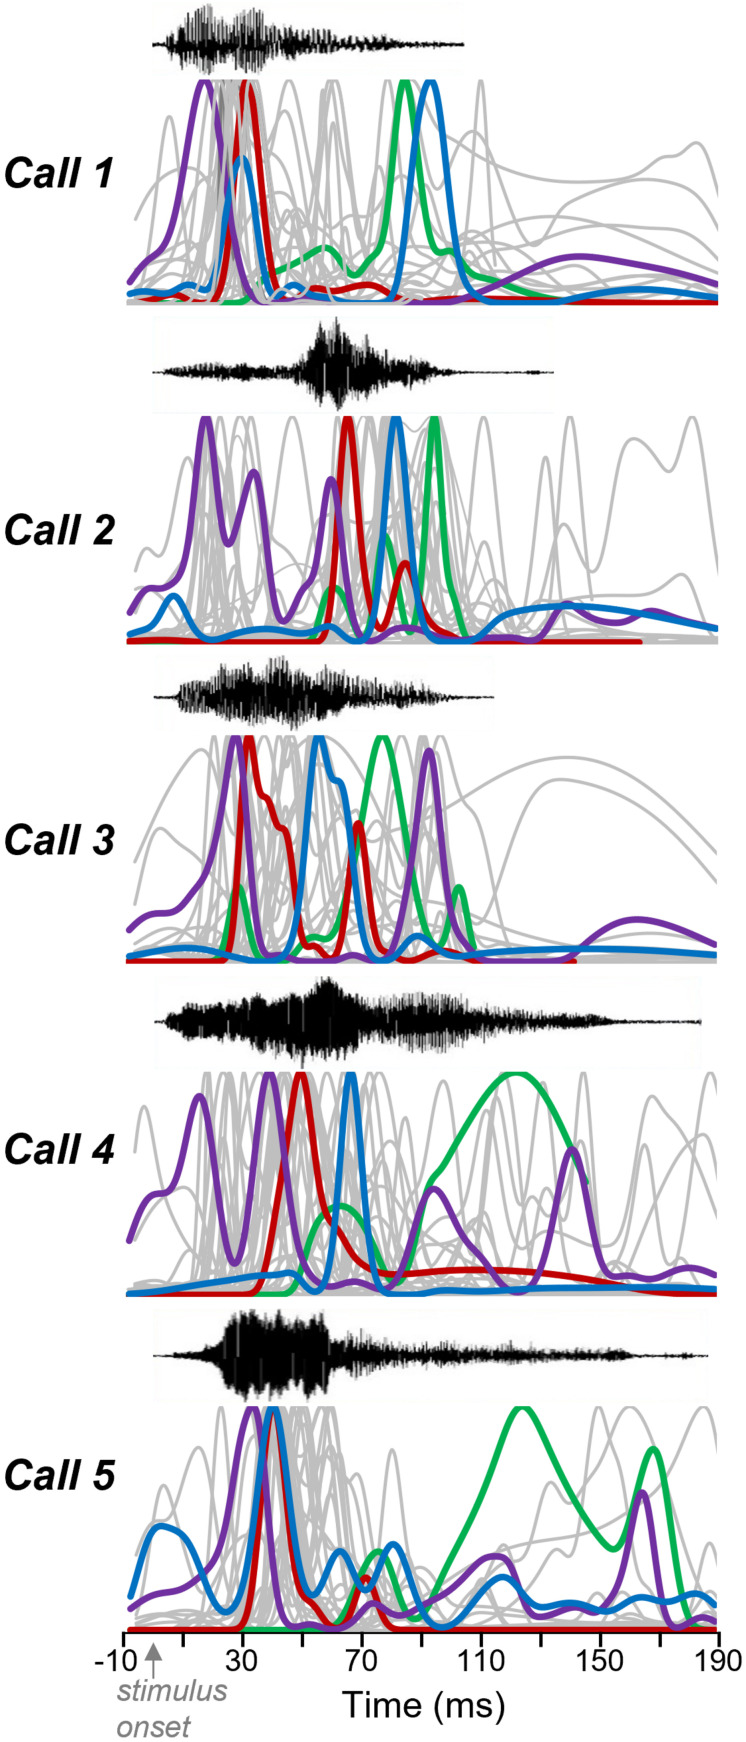
FIGURE 5.
Response features vary among neurons and calls. Oscillograms (top) and normalized spike density functions for 30 neurons across five calls. Specific colors represent spike density functions of single neurons with a range of peak response times. A given color represents responses of the same neuron across calls. Gray spike density functions are from the remaining 26 neurons.

