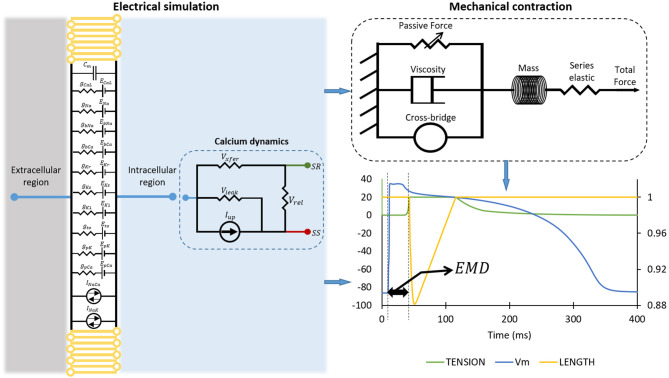
Figure 1.
The simulation protocol for obtaining two EMDs. The diagram on the left panel shows the mode of myocardial tissue. The mechanical contraction of the cell is depicted on the top right of the figure, while the bottom right of the figure shows how we calculated EMD from the electrical action potential and mechanical contraction. Please note that the plot on the bottom right has the primary x-axis as time in milliseconds, the y-axis as membrane potential of the cell in millivolt, and the secondary y-axis (on the right) as the normalized length of the cell.

