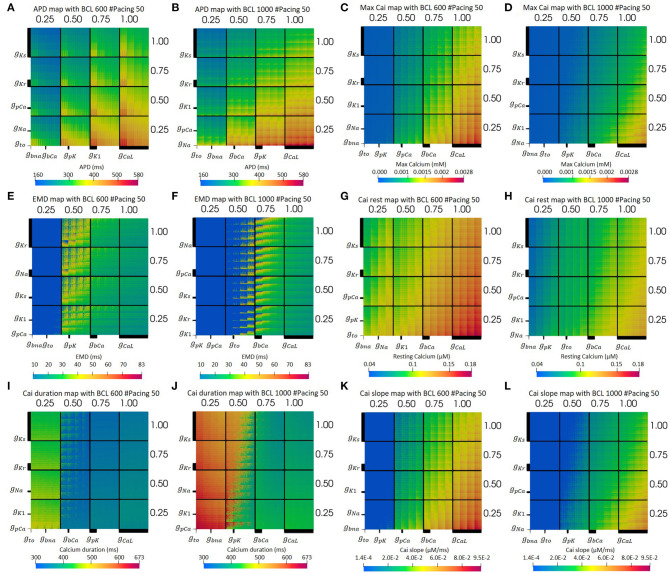
Figure 3.
The optimum dimensional stacking for both BCL 600 ms (A,C,E,G,I,K) and BCL 1,000 ms (B,D,F,H,J,L). Note that the bold line on each axis indicates the scale of each conductance variation. The biggest axis scale is 1/4 of the main axis, such as the CaL channel. The smaller one will have 1/4 the size of the bigger axis next to it. For (E,F), the bold blue dots on the left part of the map are for no-contraction cases.

