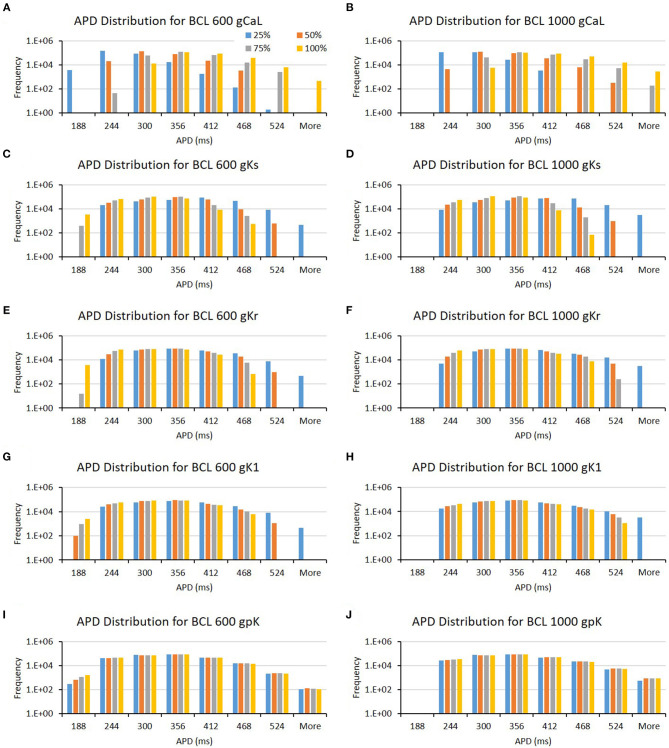
Figure 4.
The bar charts show the influence of major ion channels (based on Table 1) for prolonging APD [for BCL 600 ms (A,C,E,G,I) and for BCL 1,000 ms (B,D,F,H,J)]. The x-axis is the APD groups in milliseconds, and the y-axis is the frequency (number of appearance of APD groups) in logarithmic scale. Four conductance variations are applied (25–100%).

