Figure 1.
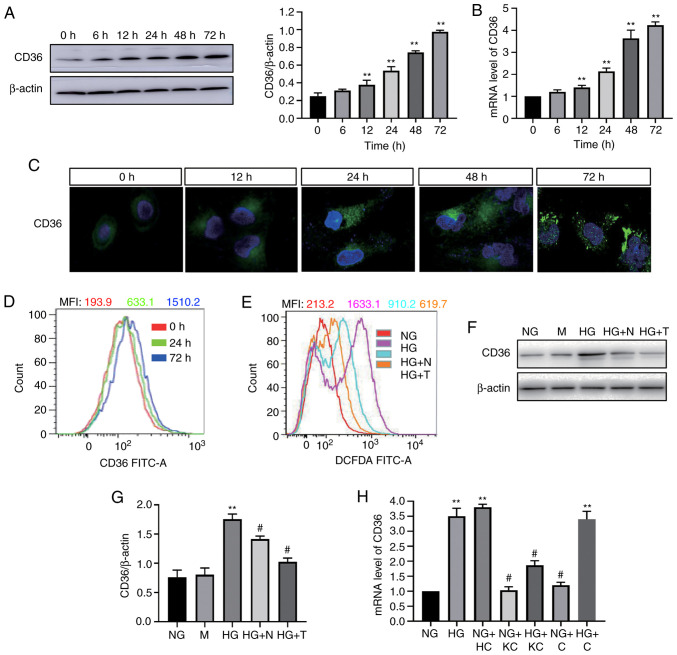
HG-induced CD36 expression in H9c2 cells is dependent on reactive oxygen species. CD36 expression was determined by western blotting (A) and reverse transcription-quantitative PCR (B) in HG-treated cells. (C) CD36 levels in the cell membrane were measured by immunofluorescence staining in HG-treated cells (magnification, ×400). (D) CD36 levels in the cell membrane were measured by flow cytometry. (E) Quantitative analysis of DCFDA fluorescence intensity using flow cytometry. (F and G) CD36 expression levels were analyzed by western blotting. (H) mRNA expression levels of CD36 were measured by reverse transcription-quantitative PCR. H9c2 cells were incubated with NG (5.6 mM, NG group), NG plus mannitol (24.4 mM, M group), HG (30 mM, HG group), HG plus N-acetylcysteine (5 mM, HG + N group) and HG plus MitoTEMPO (10 µM, HG + T group), NG plus LV3 containing CD36 (NG + HC group), NG plus LV3 containing CD36 knockout (NG + KC group), HG plus LV3 containing CD36 knockout (HG + KC group), NG plus LV3 empty vector (NG + C group) and HG plus LV3 empty vector (HG + C group) for 72 h. Data are expressed as the means ± SD. n=4. **P<0.01 vs. NG or 0 h; #P<0.05 vs. HG. HG, high glucose; NG, normal glucose; DCFDA, 2′, 7′-dichlorodihydrofluorescein diacetate.

